Exam 2: Charts and Graphs
Exam 1: Introduction to Statistics130 Questions
Exam 2: Charts and Graphs94 Questions
Exam 3: Descriptive Statistics105 Questions
Exam 4: Probability122 Questions
Exam 5: Discrete Distributions75 Questions
Exam 6: Continuous Distributions107 Questions
Exam 7: Sampling and Sampling Distributions101 Questions
Exam 8: Statistical Inference: Estimation for Single Populations75 Questions
Exam 9: Statistical Inference: Hypothesis Testing for Single Populations73 Questions
Exam 10: Statistical Inferences About Two Populations73 Questions
Exam 11: Analysis of Variance and Design of Experiments75 Questions
Exam 12: Simple Regression Analysis and Correlation75 Questions
Exam 13: Multiple Regression Analysis75 Questions
Exam 14: Building Multiple Regression Models75 Questions
Exam 15: Time-Series Forecasting and Index Numbers74 Questions
Exam 16: Analysis of Categorical Data74 Questions
Exam 17: Nonparametric Statistics79 Questions
Exam 18: Statistical Quality Control75 Questions
Exam 19: Decision Analysis77 Questions
Select questions type
Consider the following frequency distribution: Class Interval Frequency
10-under 20 15
20-under 30 25
30-under 40 10
What is the relative frequency of the first class?
Free
(Multiple Choice)
4.8/5  (33)
(33)
Correct Answer: Verified
B
According to the following graphic the most common cause of PCB Failures is a ___. 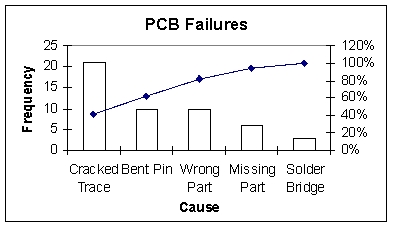
Free
(Multiple Choice)
4.8/5 (29)
Correct Answer:Verified
A
Each day, the office staff at Oasis Quick Shop prepares a frequency distribution and a histogram of sales transactions by dollar value of the transactions.Friday's histogram follows: 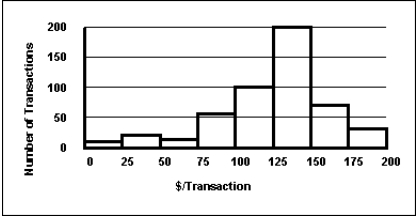 On Friday, the approximate number of sales transactions in the 125-under 150 category was ___.
Free
(Multiple Choice)
4.7/5 (38)
Correct Answer:Verified
D
Consider the relative frequency distribution given below: Class Interval Relative Frequency
20-under 40 0.2
40-under 60 0.3
60-under 80 0.4
80-under 100 0.1
There were 60 numbers in the data set.How many of the number were less than 80?
(Multiple Choice)
4.8/5 (35)
The number of phone calls arriving at a switchboard each hour has been recorded, and the following frequency distribution has been developed: Class Interval Frequency
20-under 40 30
40-under 60 45
60-under 80 80
80-under 100 45
What is the cumulative frequency of the third class?
(Multiple Choice)
4.8/5 (34)
Monthly sales were tracked and shown on the graph below. 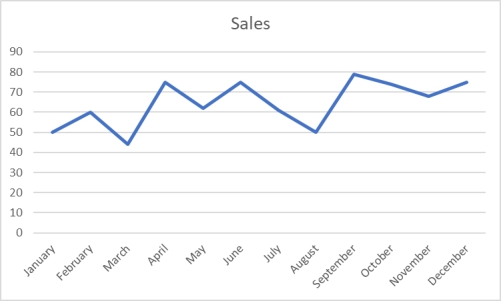 Which of the following would be an incorrect conclusion based on this graph?
(Multiple Choice)
4.9/5 (36)
For a company in gardening supplies business, the best graphical way to show the percentage of a total budget that is spent on each of a number of different expense categories is the stem and leaf plot.
(True/False)
4.8/5 (33)
The staff of Mr.Wayne Wertz, VP of Operations at Portland Peoples Bank, prepared a cumulative frequency ogive of waiting time for walk-in customers. 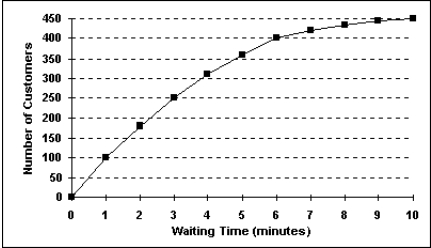 The total number of walk-in customers included in the study was ___.
(Multiple Choice)
4.8/5 (31)
Each day, the office staff at Oasis Quick Shop prepares a frequency distribution and an ogive of sales transactions by dollar value of the transactions.Saturday's cumulative frequency ogive follows: 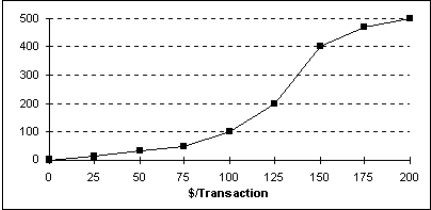 The percentage of sales transactions on Saturday that were under $100 each was ___.
(Multiple Choice)
4.8/5 (31)
Two other names for cross tabulations are ____________ and ____________.
(Multiple Choice)
4.8/5 (40)
Pinky Bauer, Chief Financial Officer of Harrison Haulers, Inc., suspects irregularities in the payroll system, and orders an inspection of "each and every payroll voucher issued since January 1, 2000." Each payroll voucher was inspected and the following frequency distribution was compiled. Errors per Voucher Number of Vouchers
0-under 2 500
2-under 4 400
4-under 6 300
6-under 8 200
8-under 10 100
The cumulative frequency of the second class interval is ___.
(Multiple Choice)
4.9/5 (31)
The staff of Ms.Tamara Hill, VP of Technical Analysis at Blue Sky Brokerage, prepared a frequency histogram of market capitalization of the 937 corporations listed on the American Stock Exchange in January 2003. 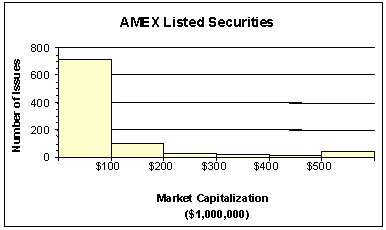 Approximately ___ corporations had capitalizations of $200,000,000 or less.
(Multiple Choice)
4.8/5 (33)
A summary of data in which raw data are grouped into different intervals and the number of items in each group is listed is called a frequency distribution.
(True/False)
4.9/5 (32)
The 2019 and 2020 market share data of the three competitors (A, B, and C)in an oligopolistic industry are presented in the following pie charts: 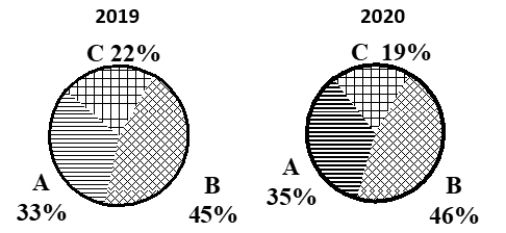 Which of the following is true?
(Multiple Choice)
4.8/5 (39)
Abel Alonzo, Director of Human Resources, is exploring employee absenteeism at the Harrison Haulers Plant during the last operating year.A review of all personnel records indicated that absences ranged from zero to twenty-nine days per employee.The following class intervals were proposed for a frequency distribution of absences: Absences Number of Employees
(Days)
0-under 10 -
10-under 20 -
20-under 30 -
Which of the following might represent a problem with this set of intervals?
(Multiple Choice)
4.9/5 (39)
One advantage of a stem and leaf plot over a frequency distribution is that the values of the original data are retained.
(True/False)
4.8/5 (32)
To consider historical data as part of their decisions, management often uses time-series data.
(True/False)
4.7/5 (32)
Pinky Bauer, Chief Financial Officer of Harrison Haulers, Inc., suspects irregularities in the payroll system, and orders an inspection of "each and every payroll voucher issued since January 1, 2000." Each payroll voucher was inspected and the following frequency distribution was compiled. Errors per Voucher Number of Vouchers
0-under 2 500
2-under 4 400
4-under 6 300
6-under 8 200
8-under 10 100
The midpoint of the first class interval is ___.
(Multiple Choice)
4.7/5 (38)
The staff of Mr.Wayne Wertz, VP of Operations at Portland Peoples Bank, prepared a frequency histogram of waiting time for walk-in customers. 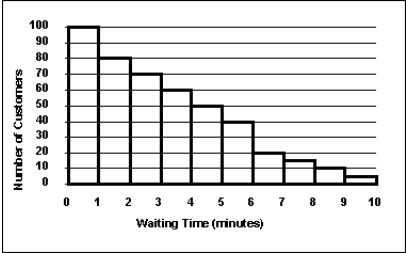 Approximately ___ walk-in customers waited less than 2 minutes.
(Multiple Choice)
4.9/5 (37)
If both variables being analyzed are nominal data, the best method to reveal any potential connections between them would be with a __________.
(Multiple Choice)
4.9/5 (35)
Filters
- Essay(0)
- Multiple Choice(0)
- Short Answer(0)
- True False(0)
- Matching(0)