Exam 15: Time-Series Forecasting and Index Numbers
Exam 1: Introduction to Statistics130 Questions
Exam 2: Charts and Graphs94 Questions
Exam 3: Descriptive Statistics105 Questions
Exam 4: Probability122 Questions
Exam 5: Discrete Distributions75 Questions
Exam 6: Continuous Distributions107 Questions
Exam 7: Sampling and Sampling Distributions101 Questions
Exam 8: Statistical Inference: Estimation for Single Populations75 Questions
Exam 9: Statistical Inference: Hypothesis Testing for Single Populations73 Questions
Exam 10: Statistical Inferences About Two Populations73 Questions
Exam 11: Analysis of Variance and Design of Experiments75 Questions
Exam 12: Simple Regression Analysis and Correlation75 Questions
Exam 13: Multiple Regression Analysis75 Questions
Exam 14: Building Multiple Regression Models75 Questions
Exam 15: Time-Series Forecasting and Index Numbers74 Questions
Exam 16: Analysis of Categorical Data74 Questions
Exam 17: Nonparametric Statistics79 Questions
Exam 18: Statistical Quality Control75 Questions
Exam 19: Decision Analysis77 Questions
Select questions type
The ratios of "actuals to moving averages" (seasonal indexes)for a time series are presented in the following table as percentages:  The initial estimate of the seasonal index for Q1 is ___.
(Multiple Choice)
4.9/5  (27)
(27)
Analysis of data for an autoregressive forecasting model produced the following tables: 
 The results indicate that ___.
(Multiple Choice)
4.8/5 (33)
Because seasonal effects can confound trend analysis, it is important to make sure that the data is free of seasonality prior to using regression models to analyze trend.
(True/False)
4.9/5 (28)
A time series with forecast values is presented in the following table:  If the mean absolute deviation (MAD)is 257, then a = ______.
(Multiple Choice)
4.9/5 (36)
Which of the following is not a component of time series data?
(Multiple Choice)
4.7/5 (35)
Using a three-month moving average (with weights of 5, 3, and 1 for the most current value, next most current value and oldest value, respectively), the forecast value for November in the following time series would be ___. 
(Multiple Choice)
4.8/5 (24)
Fitting a linear trend to 36 monthly data points (January 2017 = 1, February 2017 = 2, March 2017 = 3, etc.)produced the following tables: 
 The projected trend value for January 2020 is ___.
(Multiple Choice)
4.9/5 (27)
Two popular general categories of smoothing techniques are exponential models and logarithmic models.
(True/False)
4.8/5 (33)
A time series with forecast values and error terms is presented in the following table.The mean error (ME)for this forecast is ___. 
(Multiple Choice)
4.8/5 (32)
The following graph of a time-series data suggests a ___ trend. 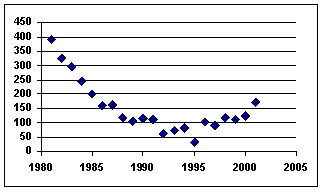
(Multiple Choice)
4.7/5 (33)
Using a three-month moving average, the forecast value for October made at the end of September in the following time series would be ___. 
(Multiple Choice)
4.8/5 (30)
A time series with forecast values and error terms is presented in the following table.The mean absolute deviation (MAD)for this forecast is ___. 
(Multiple Choice)
4.9/5 (37)
The forecast value for August was 12 and the actual value turned out to be 5.Using exponential smoothing with = 0.20, the forecast value for September would be ___.
(Multiple Choice)
4.8/5 (36)
Autocorrelation in a regression forecasting model can be detected by the F test.
(True/False)
4.8/5 (41)
What is the forecast for the Period 7 using a 3-period moving average technique, given the following time-series data for six past periods? 
(Multiple Choice)
4.8/5 (26)
A time series with forecast values and error terms is presented in the following table.The mean squared error (MSE)for this forecast is ___. 
(Multiple Choice)
4.9/5 (29)
Using 2019 as the base year, the 2018 value of the Paasche Price Index is ___.(Quantities are averages for the student body.) 
(Multiple Choice)
4.8/5 (33)
Using a three-month moving average, the forecast value for November in the following time series would be ___. 
(Multiple Choice)
4.7/5 (30)
Typically, the denominator used to calculate an index number is a measurement for the ___ period.
(Multiple Choice)
4.9/5 (35)
Filters
- Essay(0)
- Multiple Choice(0)
- Short Answer(0)
- True False(0)
- Matching(0)