Exam 15: Time-Series Forecasting and Index Numbers
Exam 1: Introduction to Statistics130 Questions
Exam 2: Charts and Graphs94 Questions
Exam 3: Descriptive Statistics105 Questions
Exam 4: Probability122 Questions
Exam 5: Discrete Distributions75 Questions
Exam 6: Continuous Distributions107 Questions
Exam 7: Sampling and Sampling Distributions101 Questions
Exam 8: Statistical Inference: Estimation for Single Populations75 Questions
Exam 9: Statistical Inference: Hypothesis Testing for Single Populations73 Questions
Exam 10: Statistical Inferences About Two Populations73 Questions
Exam 11: Analysis of Variance and Design of Experiments75 Questions
Exam 12: Simple Regression Analysis and Correlation75 Questions
Exam 13: Multiple Regression Analysis75 Questions
Exam 14: Building Multiple Regression Models75 Questions
Exam 15: Time-Series Forecasting and Index Numbers74 Questions
Exam 16: Analysis of Categorical Data74 Questions
Exam 17: Nonparametric Statistics79 Questions
Exam 18: Statistical Quality Control75 Questions
Exam 19: Decision Analysis77 Questions
Select questions type
Jim Royo, manager of Billings Building Supply (BBS), wants to develop a model to forecast BBS's monthly sales (in $1,000's).He selects the dollar value of residential building permits (in $10,000)as the predictor variable.An analysis of the data yielded the following tables: 
 Using = 0.05 the critical value of the Durbin-Watson statistic, dL, is ___.
(Multiple Choice)
4.9/5  (30)
(30)
Using a three-month moving average, the forecast value for October made at the end of September in the following time series would be ___. 
(Multiple Choice)
4.8/5 (36)
A stationary time-series data has only trend but no cyclical or seasonal effects.
(True/False)
5.0/5 (31)
The following graph of time-series data suggests a ___ trend. 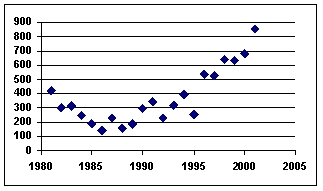
(Multiple Choice)
4.8/5 (39)
Autoregression is a multiple regression technique in which the independent variables are time-lagged versions of the dependent variable.
(True/False)
4.8/5 (40)
The long-term general direction of data is referred to as trend.
(True/False)
4.8/5 (39)
A time series with forecast values is presented in the following table:  On this table, a is some nondisclosed value.The mean square error (MSE)is ______% of a.
(Multiple Choice)
4.8/5 (37)
Forecast error is the difference between the value of the response variable and those of the explanatory variables.
(True/False)
4.9/5 (39)
One of the ways to overcome the autocorrelation problem in a regression forecasting model is to increase the level of significance for the F test
(True/False)
4.9/5 (37)
A time series with forecast values is presented in the following table:  On this table, a is some nondisclosed value.The mean absolute deviation (MAD)
Is ______% of a.
On this table, a is some nondisclosed value.The mean absolute deviation (MAD)
Is ______% of a.
(Multiple Choice)
4.8/5 (47)
Using 2019 as the base year, the 2018 value of the Laspeyres Price Index is ___. 
(Multiple Choice)
4.9/5 (45)
Mean error (ME)and mean absolute deviation (MAD)will have the same numerical value if all errors are positive.
(True/False)
4.9/5 (35)
Filters
- Essay(0)
- Multiple Choice(0)
- Short Answer(0)
- True False(0)
- Matching(0)