Exam 12: Simple Regression Analysis and Correlation
Exam 1: Introduction to Statistics130 Questions
Exam 2: Charts and Graphs94 Questions
Exam 3: Descriptive Statistics105 Questions
Exam 4: Probability122 Questions
Exam 5: Discrete Distributions75 Questions
Exam 6: Continuous Distributions107 Questions
Exam 7: Sampling and Sampling Distributions101 Questions
Exam 8: Statistical Inference: Estimation for Single Populations75 Questions
Exam 9: Statistical Inference: Hypothesis Testing for Single Populations73 Questions
Exam 10: Statistical Inferences About Two Populations73 Questions
Exam 11: Analysis of Variance and Design of Experiments75 Questions
Exam 12: Simple Regression Analysis and Correlation75 Questions
Exam 13: Multiple Regression Analysis75 Questions
Exam 14: Building Multiple Regression Models75 Questions
Exam 15: Time-Series Forecasting and Index Numbers74 Questions
Exam 16: Analysis of Categorical Data74 Questions
Exam 17: Nonparametric Statistics79 Questions
Exam 18: Statistical Quality Control75 Questions
Exam 19: Decision Analysis77 Questions
Select questions type
From the following scatter plot, we can say that between y and x there is ___. 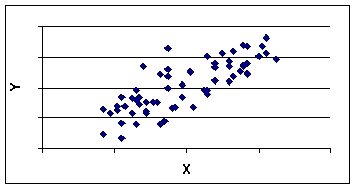
(Multiple Choice)
4.7/5  (30)
(30)
In regression, the predictor variable is called the dependent variable.
(True/False)
4.9/5 (33)
In simple regression analysis the error terms are assumed to be independent and normally distributed with zero mean and constant variance.
(True/False)
4.9/5 (35)
Abby Kuntz, a market specialist at the market research firm of Saez, Gann, and Spitz, is analyzing household budget data collected by her firm.Abby's dependent variable is monthly household expenditures on groceries (in $'s), and her independent variable is annual household income (in $1,000's).Regression analysis of the data yielded the following tables:  11eb6c3a_ec62_24fb_ad81_a7111ecfb44e_TB8417_00 Abby's sample size (n)is ___.s), and her independent variable is annual household income (in $1,000's).Regression analysis of the data yielded the following tables: Abby's sample size (n)is ___." class="answers-bank-image d-inline" loading="lazy" > Abby's sample size (n)is ___.s), and her independent variable is annual household income (in $1,000's).Regression analysis of the data yielded the following tables: Abby's sample size (n)is ___." class="answers-bank-image d-inline" loading="lazy" > 11eb6c3a_ec62_24fb_ad81_a7111ecfb44e_TB8417_00 Abby's sample size (n)is ___.
(Multiple Choice)
4.9/5 (39)
A cost accountant is developing a regression model to predict the total cost of producing a batch of car seats as a linear function of batch size (the number of seats produced in one lot or batch).The intercept of this model is the ___.
(Multiple Choice)
4.7/5 (30)
For the regression line, y = 21 − 8x, 21 is the y intercept of the line.
(True/False)
4.7/5 (29)
In a regression analysis if SST = 200 and SSR = 200, r2 = ___.
(Multiple Choice)
4.9/5 (34)
A cost accountant is developing a regression model to predict the total cost of producing a batch of car seats as a function of batch size (the number of seats produced in one lot or batch).The explanatory variable is ___.
(Multiple Choice)
4.7/5 (34)
If x and y in a regression model are totally unrelated, ___.
(Multiple Choice)
4.8/5 (30)
Louis Tang, a cost accountant at Prime Plastics, Inc.(PPI), is analyzing the manufacturing costs of a moulded plastic telephone handset produced by PPI.Louis's independent variable is production lot size (in 1,000's of units), and his dependent variable is the total cost of the lot (in $100's).Regression analysis of the data yielded the following tables: 
 Louis's sample size (n)is ___.
(Multiple Choice)
4.9/5 (21)
The proportion of variability of the dependent variable (y)accounted for or explained by the independent variable (x)is called the coefficient of correlation.
(True/False)
4.9/5 (38)
One of the assumptions made in simple regression is that ___.
(Multiple Choice)
4.9/5 (30)
Abby Kuntz, a market specialist at the market research firm of Saez, Gann, and Spitz, is analyzing household budget data collected by her firm.Abby's dependent variable is monthly household expenditures on groceries (in $'s), and her independent variable is annual household income (in $1,000's).Regression analysis of the data yielded the following tables.  11eb6c3a_ec62_731f_ad81_5b97fdcd3d3e_TB8417_00 For a household with $50,000 annual income, Abby's model predicts monthly grocery expenditures of ___.s), and her independent variable is annual household income (in $1,000's).Regression analysis of the data yielded the following tables. For a household with $50,000 annual income, Abby's model predicts monthly grocery expenditures of ___." class="answers-bank-image d-inline" loading="lazy" > For a household with $50,000 annual income, Abby's model predicts monthly grocery expenditures of ___.s), and her independent variable is annual household income (in $1,000's).Regression analysis of the data yielded the following tables. For a household with $50,000 annual income, Abby's model predicts monthly grocery expenditures of ___." class="answers-bank-image d-inline" loading="lazy" > 11eb6c3a_ec62_731f_ad81_5b97fdcd3d3e_TB8417_00 For a household with $50,000 annual income, Abby's model predicts monthly grocery expenditures of ___.
(Multiple Choice)
4.9/5 (39)
The range of admissible values for the coefficient determination is −1 to +1.
(True/False)
4.7/5 (28)
A manager wants to predict the cost (y)of travel for salespeople based on the number of days (x)spent on each sales trip.The following model has been developed: y = $400 + 120x.If a trip took 4 days, the predicted cost of the trip is ___.
(Multiple Choice)
4.7/5 (44)
To determine whether the overall regression model is significant, the F test is used.
(True/False)
4.7/5 (23)
One of the assumptions made in simple regression is that ___.
(Multiple Choice)
4.9/5 (34)
Filters
- Essay(0)
- Multiple Choice(0)
- Short Answer(0)
- True False(0)
- Matching(0)