Exam 12: Simple Regression Analysis and Correlation
Exam 1: Introduction to Statistics130 Questions
Exam 2: Charts and Graphs94 Questions
Exam 3: Descriptive Statistics105 Questions
Exam 4: Probability122 Questions
Exam 5: Discrete Distributions75 Questions
Exam 6: Continuous Distributions107 Questions
Exam 7: Sampling and Sampling Distributions101 Questions
Exam 8: Statistical Inference: Estimation for Single Populations75 Questions
Exam 9: Statistical Inference: Hypothesis Testing for Single Populations73 Questions
Exam 10: Statistical Inferences About Two Populations73 Questions
Exam 11: Analysis of Variance and Design of Experiments75 Questions
Exam 12: Simple Regression Analysis and Correlation75 Questions
Exam 13: Multiple Regression Analysis75 Questions
Exam 14: Building Multiple Regression Models75 Questions
Exam 15: Time-Series Forecasting and Index Numbers74 Questions
Exam 16: Analysis of Categorical Data74 Questions
Exam 17: Nonparametric Statistics79 Questions
Exam 18: Statistical Quality Control75 Questions
Exam 19: Decision Analysis77 Questions
Select questions type
The process of constructing a mathematical model or function that can be used to predict or determine one variable by another variable is called regression analysis.
(True/False)
4.8/5  (36)
(36)
Alan Nip, market analyst for Clear Sound Mart, is analyzing the relation between heavy metal CD sales and the size of the teenage population.He gathers data from six sales districts.Alan's dependent variable is annual heavy metal CD sales (in $1,000,000's), and his independent variable is teenage population (in 1,000's).Regression analysis of the data yielded the following tables: 
 Alan's sample size is ___.
(Multiple Choice)
4.8/5 (29)
In the regression equation, y = 75.65 + 0.80x, the intercept is ___.
(Multiple Choice)
4.9/5 (38)
Consider the following scatter plot and regression line.At x = 17, the residual (error term)is ___. 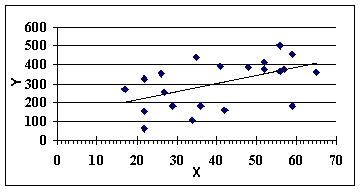
(Multiple Choice)
4.9/5 (35)
Louis Tang, a cost accountant at Prime Plastics, Inc.(PPI), is analyzing the manufacturing costs of a moulded plastic telephone handset produced by PPI.Louis's independent variable is production lot size (in 1,000's of units), and his dependent variable is the total cost of the lot (in $100's).Regression analysis of the data yielded the following tables: 
 Louis's regression model is ___.
(Multiple Choice)
4.9/5 (33)
The coefficient of determination is the proportion of variability of the dependent variable (y)accounted for or explained by the independent variable (x).
(True/False)
4.9/5 (34)
A cost accountant is developing a regression model to predict the total cost of producing a batch of car seats as a linear function of batch size (the number of seats produced in one lot or batch).The slope of the accountant's model is ___.
(Multiple Choice)
4.9/5 (27)
Alan Nip, market analyst for Clear Sound Mart, is analyzing the relation between heavy metal CD sales and the size of the teenage population.He gathers data from six sales districts.Alan's dependent variable is annual heavy metal CD sales (in $1,000,000's), and his independent variable is teenage population (in 1,000's).Regression analysis of the data yielded the following tables. 
 The numerical value of the correlation coefficient between the CD sales and the size of teenage population is ___.
(Multiple Choice)
4.8/5 (32)
In the simple regression model, y = 21 − 8x, if the coefficient of determination is 0.81, we can say that the coefficient of correlation between y and x is 0.90.
(True/False)
4.9/5 (30)
If there is perfect negative correlation between two sets of numbers, then ___.
(Multiple Choice)
4.7/5 (33)
In the regression equation, y = 75.65 + 0.80x, the slope is ___.
(Multiple Choice)
4.9/5 (34)
From the following scatter plot, we can say that between y and x there is ___. 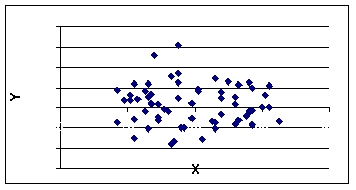
(Multiple Choice)
4.9/5 (35)
The following data is to be used to construct a regression model:  The value of the slope is ___.
(Multiple Choice)
4.7/5 (41)
A cost accountant is developing a regression model to predict the total cost of producing a batch of car seats as a function of batch size (the number of seats produced in one lot or batch).The dependent variable is ___.
(Multiple Choice)
4.7/5 (35)
Filters
- Essay(0)
- Multiple Choice(0)
- Short Answer(0)
- True False(0)
- Matching(0)