Exam 12: Simple Regression Analysis and Correlation
Exam 1: Introduction to Statistics130 Questions
Exam 2: Charts and Graphs94 Questions
Exam 3: Descriptive Statistics105 Questions
Exam 4: Probability122 Questions
Exam 5: Discrete Distributions75 Questions
Exam 6: Continuous Distributions107 Questions
Exam 7: Sampling and Sampling Distributions101 Questions
Exam 8: Statistical Inference: Estimation for Single Populations75 Questions
Exam 9: Statistical Inference: Hypothesis Testing for Single Populations73 Questions
Exam 10: Statistical Inferences About Two Populations73 Questions
Exam 11: Analysis of Variance and Design of Experiments75 Questions
Exam 12: Simple Regression Analysis and Correlation75 Questions
Exam 13: Multiple Regression Analysis75 Questions
Exam 14: Building Multiple Regression Models75 Questions
Exam 15: Time-Series Forecasting and Index Numbers74 Questions
Exam 16: Analysis of Categorical Data74 Questions
Exam 17: Nonparametric Statistics79 Questions
Exam 18: Statistical Quality Control75 Questions
Exam 19: Decision Analysis77 Questions
Select questions type
The assumptions underlying simple regression analysis include ___.
(Multiple Choice)
4.8/5  (26)
(26)
A manager wishes to predict the annual cost (y)of an automobile based on the number of kilometres (x)driven.The following model was developed: y = 1,550 + .36x.If a car is driven 20,000 kilometres, the predicted cost is ___.
(Multiple Choice)
4.9/5 (32)
A researcher has developed a regression model from fourteen pairs of data points.He wants to test to determine if the slope is significantly different from zero.He uses a two-tailed test and = 0.01.The critical table t value is ___.
(Multiple Choice)
4.7/5 (28)
Alan Nip, market analyst for Clear Sound Mart, is analyzing the relation between heavy metal CD sales and the size of the teenage population.He gathers data from six sales districts.Alan's dependent variable is annual heavy metal CD sales (in $1,000,000's), and his independent variable is teenage population (in 1,000's).Regression analysis of the data yielded the following tables: 
 For a sales district with 20,000 teenagers, Alan's model predicts annual CD sales of ___.
(Multiple Choice)
4.9/5 (35)
The coefficient of correlation in a simple regression analysis is = - 0.6.The coefficient of determination for this regression would be ___.
(Multiple Choice)
4.8/5 (37)
For following scatter plot and regression line, at x = 65 the residual is ___. 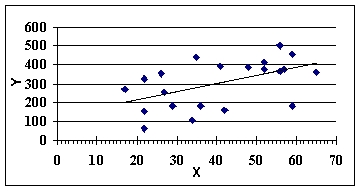
(Multiple Choice)
4.9/5 (22)
A t test is used to determine whether the coefficients of the regression model are significantly different from zero.
(True/False)
4.8/5 (31)
Louis Tang, a cost accountant at Prime Plastics, Inc.(PPI), is analyzing the manufacturing costs of a moulded plastic telephone handset produced by PPI.Louis's independent variable is production lot size (in 1,000's of units), and his dependent variable is the total cost of the lot (in $100's).Regression analysis of the data yielded the following tables: 
 Using = 0.05, Louis should ___.
(Multiple Choice)
4.8/5 (32)
From the following scatter plot, we can say that between y and x there is ___. 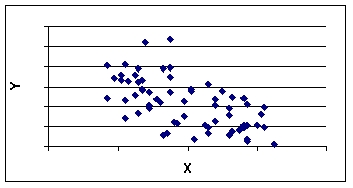
(Multiple Choice)
4.9/5 (44)
For a certain data set the regression equation is y = 21 - 8x.The correlation coefficient between y and x in this data set ___.
(Multiple Choice)
5.0/5 (38)
A manager wishes to predict the annual cost (y)of an automobile based on the number of kilometres (x)driven.The following model was developed: y = 1,550 + 0.36x.If a car is driven 15,000 kilometres, the predicted cost is ___.
(Multiple Choice)
4.8/5 (29)
The difference between the actual y value and the predicted y value found using a regression equation is called the residual.
(True/False)
4.7/5 (35)
The F value to test the overall significance of a regression model is computed by dividing the sum of squares regression (SSreg)by the sum of squares error (SSerr).
(True/False)
4.7/5 (32)
In regression, the variable that is being predicted is usually referred to as the independent variable.
(True/False)
4.9/5 (39)
The first step in simple regression analysis usually is to construct a scatter plot.
(True/False)
4.9/5 (26)
A standard deviation of the error of the regression model is called the ___.
(Multiple Choice)
4.9/5 (32)
Abby Kuntz, a market specialist at the market research firm of Saez, Gann, and Spitz, is analyzing household budget data collected by her firm.Abby's dependent variable is monthly household expenditures on groceries (in $'s), and her independent variable is annual household income (in $1,000's).Regression analysis of the data yielded the following tables:  11eb6c3a_ec61_fde9_ad81_59fe2eaa383b_TB8417_00 The correlation coefficient between the two variables in this regression is ___.s), and her independent variable is annual household income (in $1,000's).Regression analysis of the data yielded the following tables: The correlation coefficient between the two variables in this regression is ___." class="answers-bank-image d-inline" loading="lazy" > The correlation coefficient between the two variables in this regression is ___.s), and her independent variable is annual household income (in $1,000's).Regression analysis of the data yielded the following tables: The correlation coefficient between the two variables in this regression is ___." class="answers-bank-image d-inline" loading="lazy" > 11eb6c3a_ec61_fde9_ad81_59fe2eaa383b_TB8417_00 The correlation coefficient between the two variables in this regression is ___.
(Multiple Choice)
4.8/5 (31)
Alan Nip, market analyst for Clear Sound Mart, is analyzing the relation between heavy metal CD sales and the size of the teenage population.He gathers data from six sales districts.Alan's dependent variable is annual heavy metal CD sales (in $1,000,000's), and his independent variable is teenage population (in 1,000's).Regression analysis of the data yielded the following tables: 
 Using = 0.05, Alan should ___.
(Multiple Choice)
4.7/5 (38)
The numerical value of the coefficient of determination must be ___.
(Multiple Choice)
4.9/5 (39)
Filters
- Essay(0)
- Multiple Choice(0)
- Short Answer(0)
- True False(0)
- Matching(0)