Exam 1: First Principles
Exam 1: First Principles246 Questions
Exam 2: Economic Models: Trade-Offs and Trade72 Questions
Exam 3: Supply and Demand266 Questions
Exam 4: Consumer and Producer Surplus196 Questions
Exam 5: Price Controls and Quotas: Meddling With Markets203 Questions
Exam 6: Elasticity329 Questions
Exam 7: Taxes284 Questions
Exam 8: International Trade265 Questions
Exam 9: Decision Making by Individuals and Firms209 Questions
Exam 10: The Rational Consumer477 Questions
Exam 11: Behind the Supply Curve: Inputs and Costs282 Questions
Exam 12: Perfect Competition and the Supply Curve320 Questions
Exam 13: Monopoly258 Questions
Exam 14: Oligopoly212 Questions
Exam 15: Monopolistic Competition and Product Differentiation223 Questions
Exam 16: Externalities234 Questions
Exam 17: Public Goods and Common Resources237 Questions
Exam 18: The Economics of the Welfare State144 Questions
Exam 19: Factor Markets and the Distribution of Income241 Questions
Exam 20: Uncertainty, Risk, and Private Information199 Questions
Select questions type
"Teachers in northern New Hampshire should earn more money" is a normative statement.
(True/False)
4.7/5  (41)
(41)
The current rate of unemployment is 9%.This statement:
A.is positive.
B.is normative.
C.involves a value judgment.
D.is a personal reflection and has no value in economics.
(Essay)
4.9/5 (33)
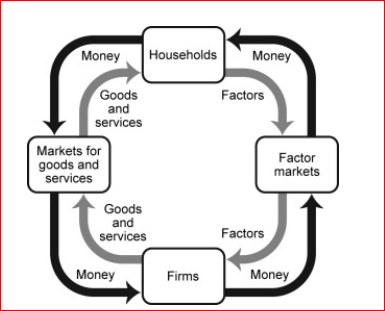
The circular-flow diagram illustrates how households goods and services and
________ factors of production.
A.buy; sell
B.buy; buy
C.own; buy
D.own; sell
(Essay)
4.8/5 (43)
(Table: Production Possibilities Schedule I) Look at the table Production Possibilities Schedule
I.If the economy produces 24 units of capital goods per period, it also can produce at most
________ units of consumer goods per period.
A.5
B.4
C.3
D.2
(Essay)
4.8/5 (35)
Economists use models to explain real-life situations because:
A.such models tend to be exactly what is occurring in each situation.
B.assumptions found in such models tend to make the problem more difficult.
C.simplifications and assumptions often yield answers that can help to explain the more difficult real-life situations.
D.real-life situations are not relevant to the building of models.
(Essay)
4.7/5 (28)
Figure: Strawberries and Submarines II
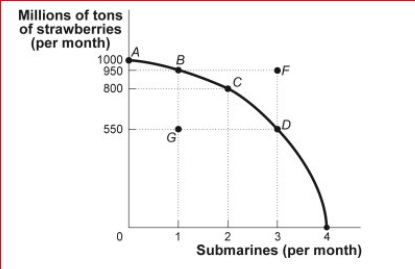
 (Figure: Strawberries and Submarines II) Look at the figure Strawberries and Submarines II.Assume that the economy is now operating at point
A.The opportunity cost of moving to point C is equal to million tons of strawberries:
A.800
B.200
C.2
D.50
(Figure: Strawberries and Submarines II) Look at the figure Strawberries and Submarines II.Assume that the economy is now operating at point
A.The opportunity cost of moving to point C is equal to million tons of strawberries:
A.800
B.200
C.2
D.50
(Essay)
4.8/5 (40)
Figure: Wine and Wheat
(Figure: Wine and Wheat) Look at the figure Wine and Wheat.If this economy is producing at point A, we know the economy is:
A.using its resources efficiently.
B.using its resources inefficiently.
C.producing at an unattainable point.
D.trading with another country.
(Essay)
4.8/5 (47)
Figure: Wine and Wheat
(Figure: Wine and Wheat) Look at the figure Wine and Wheat.If this economy is producing on the production possibility frontier, what would allow it to produce at point C?
A.an improvement in technology
B.a decrease in resources
C.a decrease in production
D.the elimination of unemployment
(Essay)
4.9/5 (38)
(Table: Bongos and Frisbees) Look at the table Bongos and Frisbees.Bill and Mickey make bongos and Frisbees.Who should specialize in the production of bongos?
A.Bill
B.Mickey
C.both
D.neither
(Essay)
4.8/5 (41)
(Table: Production Possibilities Schedule II) Look at the table Production Possibilities Schedule II.If the economy is producing at alternative X, the opportunity cost of producing at Y instead of X is units of consumer goods per period.
A.0
B.6
C.8
D.14
(Essay)
4.7/5 (31)
Figure: Production Possibilities and Circular-Flow Diagram
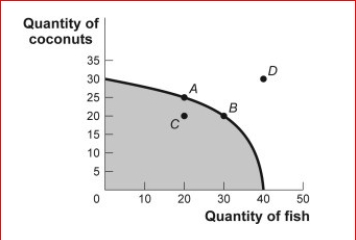
 (Figure: Production Possibilities and Circular-Flow Diagram) Look at the figure Production Possibilities and Circular-Flow Diagram.Assume the two figures represent the same economy.Suppose that in the circular-flow diagram a significant increase in productivity occurs inside most of the firms.This results in a significant increase in the output of both coconuts and fish.If all other variables remain unchanged, then the adjustment in this economy would be best represented in the production possibilities figure by a movement from point A toward:
A.point A (no movement would occur).
B.point B (an increase in fish production).
C.point C (a decrease in coconut production).
D.point D (an outward shift of the entire curve).
(Figure: Production Possibilities and Circular-Flow Diagram) Look at the figure Production Possibilities and Circular-Flow Diagram.Assume the two figures represent the same economy.Suppose that in the circular-flow diagram a significant increase in productivity occurs inside most of the firms.This results in a significant increase in the output of both coconuts and fish.If all other variables remain unchanged, then the adjustment in this economy would be best represented in the production possibilities figure by a movement from point A toward:
A.point A (no movement would occur).
B.point B (an increase in fish production).
C.point C (a decrease in coconut production).
D.point D (an outward shift of the entire curve).
(Essay)
4.8/5 (34)
Which are the two markets represented in the circular-flow diagram?
A.The market for goods and services and the market for factors.
B.The markets for households and firms.
C.The market for money and the market for goods and
D.services.The market for factors and the market for money.
(Essay)
5.0/5 (37)
In one day, Kessy can bake 10 cookies or mix 15 glasses of lemonade.His friend, Ava, can make 10 cookies or 10 glasses of lemonade.His other friend, Ian, can make 10 cookies or 20 glasses of lemonade.Who has the lowest opportunity cost in cookie production?
A.Kessy
B.Ava
C.Ian
D.Kessy and Ava have the same opportunity cost in cookie production.
(Essay)
4.8/5 (23)
One of the controversies surrounding America's energy markets is the trade-off between energy production and clean air.Assuming clean air has value, the United States will be on its production possibility frontier if and only if:
A.resources used to produce clean air and energy are not being fully utilized.
B.pollution is eliminated.
C.the price of energy is relatively low.
D.resources used to produce clean air and energy are being fully utilized.
(Essay)
4.8/5 (31)
Scenario: Linear Production Possibility Frontier
Largetown has a linear production possibility frontier, and it produces socks and shirts with 80 hours of labor.The table shows the number of hours of labor necessary to produce one sock or one shirt.
(Scenario: Linear Production Possibility Frontier) Look at the scenario Linear Production Possibility Frontier.Which of the following combinations of shirts and socks is not a feasible option for Largetown to produce?
A.20 shirts and zero socks
B.40 shirts and 40 socks
C.40 socks and zero shirts
D.10 shirts and 20 socks
(Essay)
4.8/5 (42)
In the simplest circular-flow model, households supply ________ and demand _.
A.capital; barter
B.wages and income; capital markets
C.factors of production; goods and services
D.firms; markets
(Essay)
4.8/5 (38)
The U.S.production possibility frontier will if there is a large influx of immigrants.
A.shift in
B.shift out
C.not change
D.cannot be determined from the information provided
(Essay)
4.9/5 (37)
(Table: Comparative Advantage I) Look at the table Comparative Advantage I.The opportunity cost of producing 1 box of cell phones for Sweden is:
A.10 boxes of herring.
B.0.2 box of herring.
C.5 boxes of herring.
D.0.1 box of herring.
(Essay)
4.9/5 (32)
Coworkers Yvonne and Rodney are trying to finish cleaning up the store by washing dishes and sweeping the floors.To finish both tasks as quickly as possible, they know that each of them should focus on just one task, but they don't know who should do what.To decide which coworker should wash dishes, Yvonne and Rodney should determine which one:
A.has the absolute advantage in dishwashing.
B.has the comparative advantage in dishwashing.
C.has the largest production possibility frontier in dishwashing.
D.can complete the dishwashing in the least amount of time.
(Essay)
4.8/5 (34)
Filters
- Essay(0)
- Multiple Choice(0)
- Short Answer(0)
- True False(0)
- Matching(0)