Exam 12: Chi-Square Tests and Nonparametric Tests
Exam 1: Introduction145 Questions
Exam 2: Organizing and Visualizing Data210 Questions
Exam 3: Numerical Descriptive Measures153 Questions
Exam 4: Basic Probability171 Questions
Exam 5: Discrete Probability Distributions218 Questions
Exam 6: The Normal Distribution and Other Continuous Distributions191 Questions
Exam 7: Sampling and Sampling Distributions197 Questions
Exam 8: Confidence Interval Estimation196 Questions
Exam 9: Fundamentals of Hypothesis Testing: One-Sample Tests165 Questions
Exam 10: Two-Sample Tests210 Questions
Exam 11: Analysis of Variance213 Questions
Exam 12: Chi-Square Tests and Nonparametric Tests201 Questions
Exam 13: Simple Linear Regression213 Questions
Exam 14: Introduction to Multiple Regression355 Questions
Exam 15: Multiple Regression Model Building96 Questions
Exam 16: Time-Series Forecasting168 Questions
Exam 17: Statistical Applications in Quality Management133 Questions
Exam 18: A Roadmap for Analyzing Data54 Questions
Select questions type
TABLE 12-20
Three new different models of compact SUVs have just arrived at the market. You are interested in comparing the gas mileage performance of all three models to see if they are the same. A partial computer output for twelve compact SUVs of each model is given below:
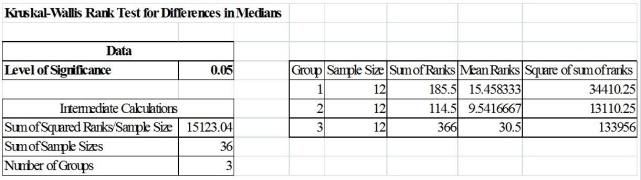 You are told that the gas mileage population distributions for all three models are not normally distributed.
-Referring to Table 12-20, what are the degrees of freedom of the Kruskal-Wallis test statistic?
You are told that the gas mileage population distributions for all three models are not normally distributed.
-Referring to Table 12-20, what are the degrees of freedom of the Kruskal-Wallis test statistic?
(Short Answer)
4.7/5  (35)
(35)
TABLE 12-2
The dean of a college is interested in the proportion of graduates from his college who have a job offer on graduation day. He is particularly interested in seeing if there is a difference in this proportion for accounting and economics majors. In a random sample of 100 of each type of major at graduation, he found that 65 accounting majors and 52 economics majors had job offers. If the accounting majors are designated as "Group 1" and the economics majors are designated as "Group 2," perform the appropriate hypothesis test using a level of significance of 0.05.
-Referring to Table 12-2, the same decision would be made with this test if the level of significance had been 0.01 rather than 0.05.
(True/False)
4.7/5 (41)
TABLE 12-14
The director of transportation of a large company is interested in the usage of the company's van pool program. She surveyed 129 of her employees on the usage of the program before and after a campaign to convince her employees to use the service and obtained the following:
Before Use Do Not Use Total After Use 27 44 71 Do Not Use 33 25 58 Total 60 69 129
She will use this information to perform test using a level of significance of 0.05.
-Referring to Table 12-14, the director now wants to know if the proportion of employees who use the service before the campaign and the proportion of employees who use the service after the campaign are the same. She should reject the null hypothesis using a 5% level of significance.
(True/False)
4.8/5 (26)
TABLE 12-16
A filling machine at a local soft drinks company is calibrated to fill the cans at a mean amount of 12 fluid ounces and a standard deviation of 0.5 ounces. The company wants to test whether the standard deviation of the amount filled by the machine is 0.5 ounces. A random sample of 15 cans filled by the machine reveals a standard deviation of 0.67 ounces.
-Referring to Table 12-16, what are the lower and upper critical values of the test when allowing for 5% probability of committing a type I error?
(Essay)
4.8/5 (30)
TABLE 12-17
A perfume manufacturer is trying to choose between 2 magazine advertising layouts. An expensive layout would include a small package of the perfume. A cheaper layout would include a "scratch-and-sniff" sample of the product. The manufacturer would use the more expensive layout only if there is evidence that it would lead to a higher approval rate. The manufacturer presents the more expensive layout to 4 groups and determines the approval rating for each group. He presents the "scratch-and-sniff" layout to 5 groups and again determines the approval rating of the perfume for each group. The data are given below. Use this to test the appropriate hypotheses with the Wilcoxon rank sum test with a level of significance of 0.05.
52 37 68 43 43 53 48 39 47
-Referring to Table 12-17, the rank given to the last observation in the "scratch-and-sniff" group is ________.
(Short Answer)
4.8/5 (32)
TABLE 12-7
Data on the percentage of 200 hotels in each of the three large cities across the world on whether minibar charges are correctly posted at checkout are given below.
Hong Kong New York Paris Yes 86\% 76\% 78\% No 14\% 24\% 22\%
At the 0.05 level of significance, you want to know if there is evidence of a difference in the proportion of hotels that correctly post minibar charges among the three cities.
-Referring to Table 12-7, the null hypothesis will be rejected.
(True/False)
4.9/5 (34)
TABLE 12-17
A perfume manufacturer is trying to choose between 2 magazine advertising layouts. An expensive layout would include a small package of the perfume. A cheaper layout would include a "scratch-and-sniff" sample of the product. The manufacturer would use the more expensive layout only if there is evidence that it would lead to a higher approval rate. The manufacturer presents the more expensive layout to 4 groups and determines the approval rating for each group. He presents the "scratch-and-sniff" layout to 5 groups and again determines the approval rating of the perfume for each group. The data are given below. Use this to test the appropriate hypotheses with the Wilcoxon rank sum test with a level of significance of 0.05.
52 37 68 43 43 53 48 39 47
-Referring to Table 12-17, the rank given to the second observation in the "scratch-and-sniff" group is ________.
(Short Answer)
4.7/5 (34)
TABLE 12-12
Parents complain that children read too few storybooks and watch too much television nowadays. A survey of 1,000 children reveals the following information on average time spent watching TV and average time spent reading storybooks.
Average time spent reading story books Average time spent watching TV Less than 1 hour Between land 2 hours More than 2 hours Less than 2 hours 90 85 130 More than 2 hours 655 32 8
-Referring to Table 12-12, if the null hypothesis of no connection between time spent watching TV and time spent reading storybooks is true, how many children watching less than 2 hours of TV and reading no more than 2 hours of storybooks on average can we expect?
(Multiple Choice)
4.8/5 (30)
TABLE 12-7
Data on the percentage of 200 hotels in each of the three large cities across the world on whether minibar charges are correctly posted at checkout are given below.
Hong Kong New York Paris Yes 86\% 76\% 78\% No 14\% 24\% 22\%
At the 0.05 level of significance, you want to know if there is evidence of a difference in the proportion of hotels that correctly post minibar charges among the three cities.
-Referring to Table 12-7, there is sufficient evidence to conclude that the proportions between Hong Kong and New York are different at a 0.05 level of significance.
(True/False)
4.8/5 (45)
In testing a hypothesis using the X² test, the theoretical frequencies are based on the
(Multiple Choice)
4.8/5 (35)
TABLE 12-5
Four surgical procedures currently are used to install pacemakers. If the patient does not need to return for follow-up surgery, the operation is called a "clear" operation. A heart center wants to compare the proportion of clear operations for the 4 procedures and collects the following numbers of patients from their own records:
Procedure A B C D Total Clear 27 41 21 7 96 Return 11 15 9 11 46 Total 38 56 30 18 142
They will use this information to test for a difference among the proportion of clear operations using a chi-square test with a level of significance of 0.05.
-Referring to Table 12-5, there is sufficient evidence to conclude that the proportions between procedure B and procedure D are different at a 0.05 level of significance.
(True/False)
4.9/5 (36)
TABLE 12-16
A filling machine at a local soft drinks company is calibrated to fill the cans at a mean amount of 12 fluid ounces and a standard deviation of 0.5 ounces. The company wants to test whether the standard deviation of the amount filled by the machine is 0.5 ounces. A random sample of 15 cans filled by the machine reveals a standard deviation of 0.67 ounces.
-Referring to Table 12-16, the decision is to reject the null hypothesis when using a 5% level of significance.
(True/False)
4.7/5 (43)
TABLE 12-16
A filling machine at a local soft drinks company is calibrated to fill the cans at a mean amount of 12 fluid ounces and a standard deviation of 0.5 ounces. The company wants to test whether the standard deviation of the amount filled by the machine is 0.5 ounces. A random sample of 15 cans filled by the machine reveals a standard deviation of 0.67 ounces.
-Referring to Table 12-16, there is sufficient evidence to conclude that the standard deviation of the amount filled by the machine is not exactly 0.5 ounces when using a 5% level of significance.
(True/False)
4.9/5 (35)
TABLE 12-16
A filling machine at a local soft drinks company is calibrated to fill the cans at a mean amount of 12 fluid ounces and a standard deviation of 0.5 ounces. The company wants to test whether the standard deviation of the amount filled by the machine is 0.5 ounces. A random sample of 15 cans filled by the machine reveals a standard deviation of 0.67 ounces.
-Referring to Table 12-16, the decision is to reject the null hypothesis when using a 10% level of significance.
(True/False)
4.8/5 (32)
TABLE 12-8
A study published in the American Journal of Public Health was conducted to determine whether the use of seat belts in motor vehicles in San Diego County depends on ethnic status. A sample of 792 children treated for injuries sustained from motor vehicle accidents was obtained, and each child was classified according to (1) ethnic status (Hispanic or non-Hispanic) and (2) seat belt usage (worn or not worn) during the accident. The number of children in each category is given in the table below.
Hisparnic Non-Hisparic Seat belts worI 31 148 Seat belts not worI! 283 330
-Referring to Table 12-8, at 5% level of significance, the critical value of the test statistic is
(Multiple Choice)
4.9/5 (23)
TABLE 12-11
The director of admissions at a state college is interested in seeing if admissions status (admitted, waiting list, denied admission) at his college is independent of the type of community in which an applicant resides. He takes a sample of recent admissions decisions and forms the following table:
Admitted Wait List Denied Total Urban 45 21 17 83 Rural 33 13 24 70 Suburban 34 12 39 85 Total 112 46 80 238
He will use this table to do a chi-square test of independence with a level of significance of 0.01.
-Referring to Table 12-11, the same decision would be made with this test if the level of significance had been 0.05.
(True/False)
4.9/5 (31)
When the parametric assumption on the distribution is met, a parametric test is usually more powerful than a nonparametric test.
(True/False)
4.8/5 (37)
TABLE 12-20
Three new different models of compact SUVs have just arrived at the market. You are interested in comparing the gas mileage performance of all three models to see if they are the same. A partial computer output for twelve compact SUVs of each model is given below:
You are told that the gas mileage population distributions for all three models are not normally distributed.
-Referring to Table 12-20, what is the value of the Kruskal-Wallis test statistic?
(Short Answer)
4.8/5 (32)
TABLE 12-18
Two new different models of compact SUVs have just arrived at the market. You are interested in comparing the gas mileage performance of both models to see if they are the same. A partial computer output for twelve compact SUVs of model 1 and thirteen of model 2 is given below:
Data Level of Significance Population 1 Sample Sample Size 12 Sum of Ranks 192.5 Population 2 Sample Sample Size 13 Sum of Ranks 132.5 Intermediate Calculations Total Sample Size n 25
You are told that the gas mileage population distributions for both models are not normally distributed.
-Referring to Table 12-18, what should be the null and alternative hypotheses of the test?
(Multiple Choice)
4.8/5 (37)
TABLE 12-5
Four surgical procedures currently are used to install pacemakers. If the patient does not need to return for follow-up surgery, the operation is called a "clear" operation. A heart center wants to compare the proportion of clear operations for the 4 procedures and collects the following numbers of patients from their own records:
Procedure A B C D Total Clear 27 41 21 7 96 Return 11 15 9 11 46 Total 38 56 30 18 142
They will use this information to test for a difference among the proportion of clear operations using a chi-square test with a level of significance of 0.05.
-Referring to Table 12-5, what is the value of the critical range for the Marascuilo procedure to test for the difference in proportions between procedure C and procedure D using a 0.05 level of significance?
(Short Answer)
4.8/5 (33)
Filters
- Essay(0)
- Multiple Choice(0)
- Short Answer(0)
- True False(0)
- Matching(0)