Exam 12: Chi-Square Tests and Nonparametric Tests
Exam 1: Introduction145 Questions
Exam 2: Organizing and Visualizing Data210 Questions
Exam 3: Numerical Descriptive Measures153 Questions
Exam 4: Basic Probability171 Questions
Exam 5: Discrete Probability Distributions218 Questions
Exam 6: The Normal Distribution and Other Continuous Distributions191 Questions
Exam 7: Sampling and Sampling Distributions197 Questions
Exam 8: Confidence Interval Estimation196 Questions
Exam 9: Fundamentals of Hypothesis Testing: One-Sample Tests165 Questions
Exam 10: Two-Sample Tests210 Questions
Exam 11: Analysis of Variance213 Questions
Exam 12: Chi-Square Tests and Nonparametric Tests201 Questions
Exam 13: Simple Linear Regression213 Questions
Exam 14: Introduction to Multiple Regression355 Questions
Exam 15: Multiple Regression Model Building96 Questions
Exam 16: Time-Series Forecasting168 Questions
Exam 17: Statistical Applications in Quality Management133 Questions
Exam 18: A Roadmap for Analyzing Data54 Questions
Select questions type
TABLE 12-18
Two new different models of compact SUVs have just arrived at the market. You are interested in comparing the gas mileage performance of both models to see if they are the same. A partial computer output for twelve compact SUVs of model 1 and thirteen of model 2 is given below:
Data Level of Significance Population 1 Sample Sample Size 12 Sum of Ranks 192.5 Population 2 Sample Sample Size 13 Sum of Ranks 132.5 Intermediate Calculations Total Sample Size n 25
You are told that the gas mileage population distributions for both models are not normally distributed.
-Referring to Table 12-18, what is the value of the Wilcoxon rank sum test statistic T₁?
(Short Answer)
4.7/5  (35)
(35)
TABLE 12-19
As part of an evaluation program, a sporting goods retailer wanted to compare the downhill coasting speeds of 4 brands of bicycles. She took 3 of each brand and determined their maximum downhill speeds. The results are presented in miles per hour in the table below.
1 43 37 41 43 2 46 38 45 45 3 43 39 42 46
-Referring to Table 12-19, the sporting goods retailer decided to perform a Kruskal-Wallis test even though the sample size in each of the 4 groups is not larger than 5. The null hypothesis of the test is ________.
(Short Answer)
4.8/5 (33)
TABLE 12-7
Data on the percentage of 200 hotels in each of the three large cities across the world on whether minibar charges are correctly posted at checkout are given below.
Hong Kong New York Paris Yes 86\% 76\% 78\% No 14\% 24\% 22\%
At the 0.05 level of significance, you want to know if there is evidence of a difference in the proportion of hotels that correctly post minibar charges among the three cities.
-Referring to Table 12-7, what are the values of the absolute difference and the critical range for the Marascuilo procedure to test for the difference in proportions between Hong Kong and Paris using a 0.05 level of significance?
(Short Answer)
4.7/5 (37)
TABLE 12-14
The director of transportation of a large company is interested in the usage of the company's van pool program. She surveyed 129 of her employees on the usage of the program before and after a campaign to convince her employees to use the service and obtained the following:
Before Use Do Not Use Total After Use 27 44 71 Do Not Use 33 25 58 Total 60 69 129
She will use this information to perform test using a level of significance of 0.05.
-Referring to Table 12-14, the director now wants to know if the proportion of employees who use the service before the campaign and the proportion of employees who use the service after the campaign are the same. What is the p-value of the test statistic using a 5% level of significance?
(Short Answer)
4.7/5 (39)
In testing the difference between two proportions using the normal distribution, we may use either a one-tail Chi-square test or two-tail Z test.
(True/False)
4.9/5 (36)
TABLE 12-4
A computer used by a 24-hour banking service is supposed to randomly assign each transaction to one of 5 memory locations. A check at the end of a day's transactions gave the counts shown in the table to each of the 5 memory locations, along with the number of reported errors.
Memory Location 1 2 3 4 5 Number of Transactions 82 100 74 92 102 Number of Reported Errors 11 12 6 9 10
The bank manager wanted to test whether the proportion of errors in transactions assigned to each of the 5 memory locations differ.
-Referring to Table 12-4, which test would be used to properly analyze the data in this experiment?
(Multiple Choice)
4.8/5 (32)
TABLE 12-3
The director of transportation of a large company is interested in the usage of her van pool. She considers her routes to be divided into local and non-local. She is particularly interested in learning if there is a difference in the proportion of males and females who use the local routes. She takes a sample of a day's riders and finds the following:
Male Ferrale Total Local 27 44 71 Nor1-Local 33 25 58 Total 60 69 129
She will use this information to perform a chi-square hypothesis test using a level of significance of 0.05.
-Referring to Table 12-3, the overall or mean proportion of local riders is ________.
(Short Answer)
4.9/5 (35)
TABLE 12-13
Recent studies have found that American children are more obese than in the past. The amount of time children spent watching television has received much of the blame. A survey of 100 ten-year-olds revealed the following with regards to weights and average number of hours a day spent watching television. We are interested in testing whether the mean number of hours spent watching TV and weights are independent at 1% level of significance.
TV Hours Weights 0-3 3-6 6+ Total More than 10 lbs. overweight 1 9 20 30 Within 10 lbs. of normal weight 20 15 15 50 More than 10 lbs. underweight 10 5 5 20 Total 31 29 40 100
-Referring to Table 12-13, if there is no connection between weights and average number of hours spent watching TV, we should expect how many children to be spending 3-6 hours on average watching TV and are more than 10 lbs. underweight?
(Multiple Choice)
4.8/5 (38)
TABLE 12-1
A corporation randomly selects 150 salespeople and finds that 66% who have never taken a self-improvement course would like such a course. The firm did a similar study 10 years ago in which 60% of a random sample of 160 salespeople wanted a self-improvement course. The groups are assumed to be independent random samples. Let π₁ and π₂ represent the true proportion of workers who would like to attend a self-improvement course in the recent study and the past study, respectively.
-Referring to Table 12-1, the company tests to determine at the 0.05 level whether the population proportion has changed from the previous study. Which of the following is most correct?
(Multiple Choice)
4.9/5 (39)
TABLE 12-7
Data on the percentage of 200 hotels in each of the three large cities across the world on whether minibar charges are correctly posted at checkout are given below.
Hong Kong New York Paris Yes 86\% 76\% 78\% No 14\% 24\% 22\%
At the 0.05 level of significance, you want to know if there is evidence of a difference in the proportion of hotels that correctly post minibar charges among the three cities.
-Referring to Table 12-7, there is sufficient evidence to conclude that the proportions between Hong Kong and Paris are different at a 0.05 level of significance.
(True/False)
4.9/5 (35)
TABLE 12-5
Four surgical procedures currently are used to install pacemakers. If the patient does not need to return for follow-up surgery, the operation is called a "clear" operation. A heart center wants to compare the proportion of clear operations for the 4 procedures and collects the following numbers of patients from their own records:
Procedure A B C D Total Clear 27 41 21 7 96 Return 11 15 9 11 46 Total 38 56 30 18 142
They will use this information to test for a difference among the proportion of clear operations using a chi-square test with a level of significance of 0.05.
-Referring to Table 12-5, the null hypothesis will be rejected.
(True/False)
4.9/5 (34)
TABLE 12-20
Three new different models of compact SUVs have just arrived at the market. You are interested in comparing the gas mileage performance of all three models to see if they are the same. A partial computer output for twelve compact SUVs of each model is given below:
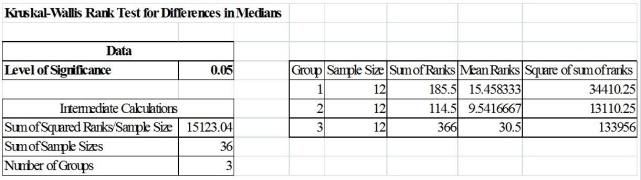 You are told that the gas mileage population distributions for all three models are not normally distributed.
-Referring to Table 12-20, what should be the null and alternative hypotheses of the test?
You are told that the gas mileage population distributions for all three models are not normally distributed.
-Referring to Table 12-20, what should be the null and alternative hypotheses of the test?
(Multiple Choice)
4.8/5 (40)
TABLE 12-15
The director of the MBA program of a state university wanted to know if a one week orientation would change the proportion among potential incoming students who would perceive the program as being good. Given below is the result from 215 students' view of the program before and after the orientation.
After the Orientation Before the Orientation Good Not Good Total Good 93 37 130 Not Good 71 14 85 Total 164 51 215
-Referring to Table 12-15, what is the p-value of the test statistic using a 5% level of significance?
(Short Answer)
4.9/5 (28)
TABLE 12-10
One criterion used to evaluate employees in the assembly section of a large factory is the number of defective pieces per 1,000 parts produced. The quality control department wants to find out whether there is a relationship between years of experience and defect rate. Since the job is repetitious, after the initial training period any improvement due to a learning effect might be offset by a loss of motivation. A defect rate is calculated for each worker in a yearly evaluation. The results for 100 workers are given in the table below.
Years Since Training Period Digefect Rate: High <1 Year 1-4 Years 5-9 Years 6 9 9 Average 9 19 23 Low 7 8 10
-Referring to Table 12-10, a test was conducted to determine if a relationship exists between defect rate and years of experience. Which of the following p-values would indicate that defect rate and years of experience are dependent? Assume you are testing at ? = 0.05.
(Multiple Choice)
4.9/5 (33)
TABLE 12-7
Data on the percentage of 200 hotels in each of the three large cities across the world on whether minibar charges are correctly posted at checkout are given below.
Hong Kong New York Paris Yes 86\% 76\% 78\% No 14\% 24\% 22\%
At the 0.05 level of significance, you want to know if there is evidence of a difference in the proportion of hotels that correctly post minibar charges among the three cities.
-Referring to Table 12-7, the expected cell frequency for the Hong Kong/Yes cell is ________.
(Short Answer)
4.8/5 (33)
TABLE 12-6
According to an article in Marketing News, fewer checks are being written at the grocery store checkout than in the past. To determine whether there is a difference in the proportion of shoppers who pay by check among three consecutive years at a 0.05 level of significance, the results of a survey of 500 shoppers in three consecutive years are obtained and presented below.
Year Check Written Year 1 Year 2 Year 3 Yes 225 175 125 No 275 325 375
-Referring to Table 12-6, what is the value of the critical range for the Marascuilo procedure to test for the difference in proportions between year 1 and year 2 using a 0.05 level of significance?
(Short Answer)
4.7/5 (36)
TABLE 12-7
Data on the percentage of 200 hotels in each of the three large cities across the world on whether minibar charges are correctly posted at checkout are given below.
Hong Kong New York Paris Yes 86\% 76\% 78\% No 14\% 24\% 22\%
At the 0.05 level of significance, you want to know if there is evidence of a difference in the proportion of hotels that correctly post minibar charges among the three cities.
-Referring to Table 12-7, the decision made suggests that the 3 cities all have different proportions of hotels that correctly post minibar charges.
(True/False)
4.8/5 (27)
TABLE 12-20
Three new different models of compact SUVs have just arrived at the market. You are interested in comparing the gas mileage performance of all three models to see if they are the same. A partial computer output for twelve compact SUVs of each model is given below:
You are told that the gas mileage population distributions for all three models are not normally distributed.
-Referring to Table 12-20, what is your decision on the test using a 5% level of significance?
(Short Answer)
4.9/5 (29)
TABLE 12-7
Data on the percentage of 200 hotels in each of the three large cities across the world on whether minibar charges are correctly posted at checkout are given below.
Hong Kong New York Paris Yes 86\% 76\% 78\% No 14\% 24\% 22\%
At the 0.05 level of significance, you want to know if there is evidence of a difference in the proportion of hotels that correctly post minibar charges among the three cities.
-Referring to Table 12-7, the critical value of the test is ________.
(Short Answer)
4.9/5 (36)
TABLE 12-12
Parents complain that children read too few storybooks and watch too much television nowadays. A survey of 1,000 children reveals the following information on average time spent watching TV and average time spent reading storybooks.
Average time spent reading story books Average time spent watching TV Less than 1 hour Between land 2 hours More than 2 hours Less than 2 hours 90 85 130 More than 2 hours 655 32 8
-Referring to Table 12-12, how many children in the survey spent less than 2 hours watching TV and more than 2 hours reading storybooks on average?
(Multiple Choice)
4.9/5 (24)
Filters
- Essay(0)
- Multiple Choice(0)
- Short Answer(0)
- True False(0)
- Matching(0)