Exam 13: F Tests and Analysis of Variance
Exam 1: An Introduction to Statistics44 Questions
Exam 2: Descriptive Statistics I: Elementary Data Presentation and Description147 Questions
Exam 3: Descriptive Statistics II: Additional Descriptive Measures and Data Displays128 Questions
Exam 4: Probability147 Questions
Exam 5: Discrete Probability Distributions144 Questions
Exam 6: Continuous Probability Distributions141 Questions
Exam 7: Statistical Inference: Estimating a Population Mean134 Questions
Exam 8: Interval Estimates for Proportions, Mean Differences and Proportion Differences19 Questions
Exam 9: Statistical Hypothesis Testing: Hypothesis Tests for a Population Mean62 Questions
Exam 10: Hypothesis Tests for Proportions, Mean Differences and Proportion Differences39 Questions
Exam 11: Basic Regression Analysis111 Questions
Exam 12: Multiple Regression53 Questions
Exam 13: F Tests and Analysis of Variance95 Questions
Exam 14: Experimental Designonline Only64 Questions
Exam 16: Chi-Square Tests145 Questions
Select questions type
In a completely randomized design, experimental units are arranged into similar groups based on extraneous factors in an effort to reduce error variation in experimental results.
(True/False)
4.8/5  (33)
(33)
The F distribution can be used to describe how the ratio of two sample variances behaves when the two samples have been independently selected from normal populations with the same variance.
(True/False)
4.8/5 (34)
A random sample of size 8 is selected from normal population A.A second, independent, random sample of size 5 is selected from normal population B.You test a null hypothesis that the variances of the two populations are equal, using a 10% significance level.If the test statistic is calculated as the ratio of sample variance A to sample variance B, the critical F value, Fc , for your test should be
(Multiple Choice)
5.0/5 (28)
Morton Products is testing three procedures for processing and shipping online orders.In the test, 12 orders were randomly selected.Four of the orders were randomly assigned Procedure 1, four others were assigned Procedure 2, and the remaining four were assigned Procedure 3.Processing/shipping times for each of the three samples are given below: 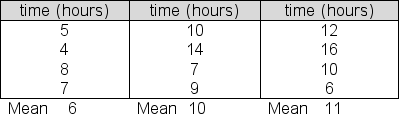 At a 5% significance level, test the null hypothesis that the average processing/shipping times for the three populations are equal.Report the between group sum of squares (SSB) for this test.
(Multiple Choice)
4.8/5 (34)
You are testing the equality of population means using ANOVA.The partial ANOVA table appears below.The between-groups mean square value is 1540.

(True/False)
4.8/5 (30)
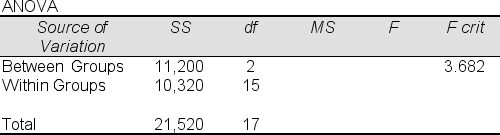
The ANOVA table below shows partial results for a test of a "no difference in population means" null hypothesis.At a 5% significance level, what is the.critical value (Fc) for the test.? 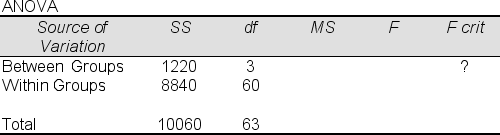
(Multiple Choice)
4.9/5 (36)
The within groups mean square in a one-way analysis of variance is the within groups sum of squares divided by (n-1) degrees of freedom.
(True/False)
4.9/5 (35)
The computed F value (Fstat) in a one-way analysis of variance is the ratio of the within groups mean square (MSW) to the between groups mean square (MSB).
(True/False)
4.8/5 (33)
Crawford Industries purchases step-down electrical converters from two suppliers.The converters from the two suppliers appear to have the same average life (measured in hours) but the variability in useful life appears be different for the units provided by the two suppliers.In random samples of 8 converters from supplier A and 8 converters from supplier B, the standard deviation in sample A was 40 hours; the standard deviation in sample B was 55 hours.Assume that converter life is normally distributed in each population.Test the null hypothesis that the population variance B is no greater than the population variancedeviation A, against the alternative hypothesis that the population variance B is greater than population variance A.Use a significance level of 5% for this one-tailed test and report the critical F (Fc) for the test.
(Multiple Choice)
4.9/5 (41)
Crawford Industries purchases step-down electrical converters from two suppliers.The converters from the two suppliers appear to have the same average life (measured in hours) but the variability in useful life appears be different for the units provided by the two suppliers.In random samples of 8 converters from supplier A and 8 converters from supplier B, the standard deviation in sample A was 40 hours; the standard deviation in sample Bwas 55 hours.Assume that transformer life is normally distributed in each population..Test the null hypothesis that population variance B is no greater than the population variance A, against the alternative hypothesis that the population variance B is greater than the population variance A.Use a significance level of 5% for this one-tailed test and report your conclusion.
(Multiple Choice)
4.9/5 (33)
A test involving three brands of cell phone was conducted to compare the brands with respect to the average number of battery recharges before the battery no longer functioned properly.Six phones of each brand were tested, with the following results: Number of recharges before battery no longer functions
 At a 5% significance level, test the hypothesis that the average maximum number of possible recharges prior to failure is the same for all three brands.The ANOVA table for the test is shown below.Complete the table and report your conclusion.
(Multiple Choice)
4.8/5 (39)
One-way analysis of variance is being used to test the equality of five population means using a sample of size 8 from each of the five populations.How many degrees of freedom are associated with the between groups sum of squares (SSB)?
(Multiple Choice)
4.9/5 (48)
A completely randomized experimental design would be the appropriate method to answer which of the following research questions?
(Multiple Choice)
4.8/5 (36)
You are testing the equality of population means using one-way ANOVA.The partial ANOVA table appears below.If the samples used in the ANOVA are all the same size, what is the sample size? 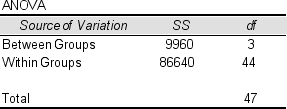
(Multiple Choice)
4.9/5 (41)
A study is being conducted to compare characteristics of women in senior executive positions and men in senior executive positions at major US corporations.A sample of four senior executive men and four senior executive women is selected.The table below shows the number of years of management experience before promotion to a senior executive position for each of the two samples. 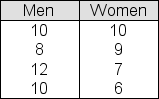 You will use a t-test assuming equal population variances (standard deviations) to test the null hypothesis that the average time before promotion in the populations represented here is the same for men and women.The significance level is .05.Report the t-score (tstat) for the test.
(Multiple Choice)
4.9/5 (33)
Crawford Industries purchases step-down electrical converters from two suppliers.The converters from the two suppliers appear to have the same average life (measured in hours) but the variability in useful life appears be different for the the two suppliers.In random samples of 9 converters from supplier A and 9 converters from supplier B, the variance in thesample A was 600; the variance in the sample B was 2800.Assume that the life of the converters is normally distributed in each population.Test the hypothesis that the variances of the two populations are equal, using a significance level of 2%.Report the F statistic (Fstat) for the test.
(Multiple Choice)
4.8/5 (31)
One-way analysis of variance is being used to test the equality of three population means using a sample of size 12 from each of the three populations.The between groups sum of squares (SSB) is 4,250 and the within groups sum of squares (SSW) is 33,660.The test statistic (Fstat) is
(Multiple Choice)
4.7/5 (33)
A random sample of size 18 from normal population A has a standard deviation of 25.A random sample of size 8 from normal population B has a standard deviation of 50.You will test the hypothesis that the variance of population A is equal to the variance of population B, using a 10% significance level.Report the critical value of F (Fc) for the test.
(Multiple Choice)
4.8/5 (43)
Crawford Industries purchases step-down electrical converters from two suppliers.The converters from the two suppliers appear to have the same average life (measured in hours) but the variability in useful life appears be different for the two suppliers.In random samples of 8 converters from supplier A and 8 converters from supplier B, the variance in sample A was 1600; the variance in sample B was 3800.Assume that the life of the converters is normally distributed in each population.Test the null hypothesis that the variance of population B is no greater than the variance of population A, against the alternative hypothesis that the variance of population B is greater than the variance of population A..Use a significance level of 5% and report the F statistic (Fstat) for this one-tailed test.
(Multiple Choice)
4.8/5 (29)
In an experimental study, the investigator has the ability to directly influence or manipulate one or more of the elements involved in the investigation.
(True/False)
4.8/5 (33)
Filters
- Essay(0)
- Multiple Choice(0)
- Short Answer(0)
- True False(0)
- Matching(0)