Exam 13: F Tests and Analysis of Variance
Exam 1: An Introduction to Statistics44 Questions
Exam 2: Descriptive Statistics I: Elementary Data Presentation and Description147 Questions
Exam 3: Descriptive Statistics II: Additional Descriptive Measures and Data Displays128 Questions
Exam 4: Probability147 Questions
Exam 5: Discrete Probability Distributions144 Questions
Exam 6: Continuous Probability Distributions141 Questions
Exam 7: Statistical Inference: Estimating a Population Mean134 Questions
Exam 8: Interval Estimates for Proportions, Mean Differences and Proportion Differences19 Questions
Exam 9: Statistical Hypothesis Testing: Hypothesis Tests for a Population Mean62 Questions
Exam 10: Hypothesis Tests for Proportions, Mean Differences and Proportion Differences39 Questions
Exam 11: Basic Regression Analysis111 Questions
Exam 12: Multiple Regression53 Questions
Exam 13: F Tests and Analysis of Variance95 Questions
Exam 14: Experimental Designonline Only64 Questions
Exam 16: Chi-Square Tests145 Questions
Select questions type
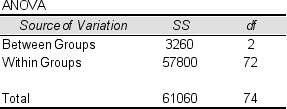
You are testing the equality of population means using ANOVA.The partial ANOVA table appears below.According to the table, four population means are involved in the test.
(True/False)
4.9/5  (34)
(34)
Greengrow, Inc.is evaluating three new fertilizer mixes.During a trial period, four young plants of equal size were randomly assigned to each fertilizer mix.Plant heights (in centimeters) at the end of the trial period are shown below: 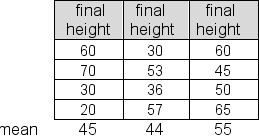 You are to use the sample data to test the null hypothesis that the average heights for the three populations represented here are the same, using a significance level of 5%.Compute the F value (Fstat) for the test and report your conclusion.
(Multiple Choice)
4.8/5 (34)
Crawford Industries purchases step-down electrical converters from two suppliers.The converters from the two suppliers appear to have the same average life (measured in hours) but the variability in useful life appears be different for the two suppliers.In random samples of 8 converters from supplier A and 8 converters from supplier B, the variance in sample A was 1600; the variance in sample B was 3800.Assume that the life of the converters is normally distrusted in each population..Test the null hypothesis that the variance of population B is no greater than the variance of population A, against the alternative hypothesis that the variation of population B variance is greater than the variance of population A.Use a significance level of 5% for this one-tailed test and report your conclusion.
(Multiple Choice)
4.7/5 (41)
You are testing the equality of four population means with four samples of size six.To compute the within-groups mean square, you should divide the total sum of squares by 3.
(True/False)
4.7/5 (30)
In a randomized block design, experimental units are arranged into similar groups based on extraneous factors in an effort to reduce error variation in experimental results.
(True/False)
4.9/5 (31)
A random sample of size 15 selected from normal population A has standard deviation of 80.A second, independent, random sample of size 8 selected from normal population B has a standard deviation of 100.You will test a null hypothesis that the variances of the two populations are equal, using a 2% significance level.Report your conclusion.
(Multiple Choice)
4.8/5 (37)
A factorial design would be the appropriate method to answer which of the following research questions?
(Multiple Choice)
5.0/5 (43)
You are conducting a study to compare the characteristics of women and men in senior executive positions at major US corporations.Samples of four senior executive men and four senior executive women are selected.At a 5% significance level, you use one-way analysis of variance to test the null hypothesis that the average time before promotion is the same for men and women.Report the critical value for F (Fc) that should be used in the test.
(Multiple Choice)
4.7/5 (30)
A statistical procedure using two independent estimates of the same population variance to test for differences between or among the means of populations is called
(Multiple Choice)
4.7/5 (31)
Eva would like to determine whether her running pace is more consistent in the afternoon than in the morning.A sample of 10 morning runs (from population 1) has an average pace of 7 minutes, 32 seconds per mile, with a standard deviation of 45 seconds per mile.A sample of 12 afternoon runs (from population 2) has an average pace of 7 minutes, 20 seconds per mile, with a standard deviation of 32 seconds per mile.She assumes that her running times follow a normal distribution in both populations. She uses the data to test the following hypotheses:
H0: σ12 ≤ σ22 (the morning variance is less than or equal to the afternoon variance)
HA: σ12 > σ22 (the morning variance is greater than the afternoon variance)
What is the value of the test statistic, Fstat?
(Multiple Choice)
4.7/5 (36)
Kensington, Inc.is evaluating three possible bonus incentive programs for its sales staff.During a trial period, a sample of four sales staff was randomly assigned to each bonus program.Individual sales figures (in $1000s) are shown below: 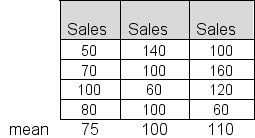 Use the sample data to test the null hypothesis that average sales for the three populations represented here are the same, at a significance level of 5%.Report the between group mean square (MSB).
(Multiple Choice)
4.9/5 (34)
Greengrow, Inc.is evaluating three new fertilizer mixes.During a trial period, five similar young plants of equal size were randomly assigned to each fertilizer mix.Plant heights (in centimeters) were measured at the end of the trial period.The tables below summarize (partially) the test results.Use the sample results to test the null hypothesis that average heights for the three populations represented here are the same, using a significance level of 5%.Compute the F value (Fstat) for the test. 
(Multiple Choice)
4.9/5 (44)
One of the assumptions for the one-way analysis of variance is that the standard deviations - and so the variances - are not the same for all the populations.
(True/False)
4.8/5 (27)
You are testing the equality of population means using ANOVA and a 5% significance level.If the p-value for the Fstat that you produce is .0212, you should conclude that the population means are not equal.
(True/False)
4.7/5 (38)
One-way analysis of variance is being used to test the equality of four population means using a sample of size 10 from each of the four populations.The between groups sum of squares (SSB) is 2700 and the within groups sum of squares (SSW) is 14,400.The test statistic (Fstat) for the test is
(Multiple Choice)
4.8/5 (31)
Filters
- Essay(0)
- Multiple Choice(0)
- Short Answer(0)
- True False(0)
- Matching(0)