Exam 11: Basic Regression Analysis
Exam 1: An Introduction to Statistics44 Questions
Exam 2: Descriptive Statistics I: Elementary Data Presentation and Description147 Questions
Exam 3: Descriptive Statistics II: Additional Descriptive Measures and Data Displays128 Questions
Exam 4: Probability147 Questions
Exam 5: Discrete Probability Distributions144 Questions
Exam 6: Continuous Probability Distributions141 Questions
Exam 7: Statistical Inference: Estimating a Population Mean134 Questions
Exam 8: Interval Estimates for Proportions, Mean Differences and Proportion Differences19 Questions
Exam 9: Statistical Hypothesis Testing: Hypothesis Tests for a Population Mean62 Questions
Exam 10: Hypothesis Tests for Proportions, Mean Differences and Proportion Differences39 Questions
Exam 11: Basic Regression Analysis111 Questions
Exam 12: Multiple Regression53 Questions
Exam 13: F Tests and Analysis of Variance95 Questions
Exam 14: Experimental Designonline Only64 Questions
Exam 16: Chi-Square Tests145 Questions
Select questions type
Suppose a rental car company uses simple linear regression to develop an equation that predicts the repair costs for each of its vehicles based on the mileage of the car (total miles driven).The company uses the following data on repair costs and miles driven for five of its cars: 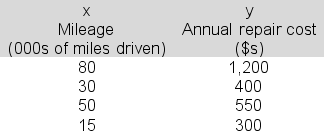 The least squares line would predict annual repair costs of $______ for a car with 60,000 miles on the odometer (rounded to the nearest whole dollar).
(Multiple Choice)
4.9/5  (36)
(36)
In simple linear regression, there is an additive relationship between SST, SSR, and SSE: that is, SST = SSR + SSE
(True/False)
4.9/5 (28)
The coefficient of determination r2, a measure of the goodness of fit of the estimated regression equation, is the ratio of the explained variation in y to the total variation in y, and takes on values between 0 and 1.
(True/False)
4.9/5 (51)
You are attempting to link weekly hours of exercise (x) to blood pressure (y) using simple linear regression and the following data: 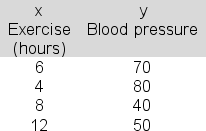 The estimated regression equation is y = 90 - 4x.Compute the standard error of estimate.
(Multiple Choice)
4.8/5 (34)
The following data have been collected for a simple linear regression analysis relating sales (y) to price (x): 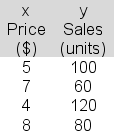 The slope term (b) in the estimated regression equation is -12.The intercept term (a) is 162.Show the 90% prediction interval for sales in a particular case in which price is $6 (that is, for x = 6).Report the upper bound for your interval.
(Multiple Choice)
4.8/5 (26)
The regression printout below shows the results of a regression analysis intended to link variable x to variable y.A sample of 25 data points was used.  Can you use the sample results shown here to reject a β = 0 null hypothesis at the 1% significance level? Explain.
(Multiple Choice)
4.9/5 (30)
In regression analysis, which of the following is NOT a required assumption about the error term ?
(Multiple Choice)
4.9/5 (39)
In simple linear regression, rejecting the null hypothesis in the key hypothesis test regarding the slope of the "population" line means we haven't yet found sufficient sample evidence that there's a useful linear relationship between x and y.
(True/False)
5.0/5 (39)
You are attempting to link weekly hours of exercise (x) to blood pressure (y) using simple linear regression and the following data: 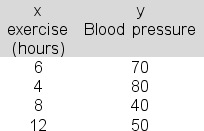 In applying the least squares criterion, the slope (b) and the intercept (a) for the best-fitting line are b = -4 and a = 90.Produce the 95% confidence interval estimate of expected blood pressure when weekly exercise is 5 hours (that is, for x = 5) and report the upper bound for the interval.
(Multiple Choice)
4.8/5 (21)
In simple linear regression, the slope and intercept values for the least squares line fit to a sample of data points serve as point estimates of the slope and intercept terms of the least squares line that would be fit to the population of data points.
(True/False)
4.7/5 (35)
The following data are available for a simple linear regression analysis attempting to link hours of training (x) to hourly output (y). 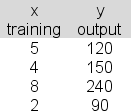 The least squares line would predict _______ units of output per hour when training is 7 hours.
(Multiple Choice)
4.9/5 (31)
The computer output table below shows partial results for a linear regression analysis.To test the "no useful linear relationship" hypothesis, determine tstat for the sample slope-a value that would be entered in the indicated cell of the output table as shown. 

(Multiple Choice)
4.9/5 (30)
You are attempting to link responses to a job announcement (y) to the number of days the announcement was repeated (x): 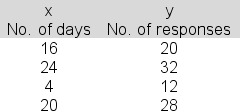 The estimated regression equation is y = 7 + 1.0x.Compute the standard error of estimate.
(Multiple Choice)
4.7/5 (33)
Which of the following is NOT true regarding the coefficient of determination, r2?
(Multiple Choice)
4.9/5 (45)
Partial regression results from a sample of 24 observations are shown below.Determine the value for R2, the coefficient of determination here. 

(Multiple Choice)
4.8/5 (38)
The purpose of regression analysis is to find a mathematical relationship that allows us to:
(Multiple Choice)
4.8/5 (38)
A National Football League agent is conducting a simple linear regression study linking completion percentage in a season (x) to salary per game(y) for quarterbacks.The data for five players are shown below. 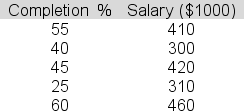 The slope for the least squares line is 4.4.The intercept is 182.Determine sy.x, the standard error of estimate, that should be entered in the table below.

(Multiple Choice)
4.8/5 (35)
In simple linear regression, the least squares line fit to a sample of data points seeks to minimize the maximum distance of points from the line.
(True/False)
4.8/5 (43)
In simple linear regression, given SSE = 2348 and SST = 3569,
(Multiple Choice)
4.9/5 (52)
In multiple regression, a single independent variable is linked to a set of two or more dependent variables.
(True/False)
4.8/5 (34)
Filters
- Essay(0)
- Multiple Choice(0)
- Short Answer(0)
- True False(0)
- Matching(0)