Exam 11: Basic Regression Analysis
Exam 1: An Introduction to Statistics44 Questions
Exam 2: Descriptive Statistics I: Elementary Data Presentation and Description147 Questions
Exam 3: Descriptive Statistics II: Additional Descriptive Measures and Data Displays128 Questions
Exam 4: Probability147 Questions
Exam 5: Discrete Probability Distributions144 Questions
Exam 6: Continuous Probability Distributions141 Questions
Exam 7: Statistical Inference: Estimating a Population Mean134 Questions
Exam 8: Interval Estimates for Proportions, Mean Differences and Proportion Differences19 Questions
Exam 9: Statistical Hypothesis Testing: Hypothesis Tests for a Population Mean62 Questions
Exam 10: Hypothesis Tests for Proportions, Mean Differences and Proportion Differences39 Questions
Exam 11: Basic Regression Analysis111 Questions
Exam 12: Multiple Regression53 Questions
Exam 13: F Tests and Analysis of Variance95 Questions
Exam 14: Experimental Designonline Only64 Questions
Exam 16: Chi-Square Tests145 Questions
Select questions type
The following data are available for a simple linear regression analysis attempting to link hours of training (x) to hourly output (y). 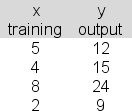 In applying the least squares criterion, the slope (b) and the intercept (a) for the best-fitting line are b = 2.4 and a = 3.6.Set up a hypothesis test to determine whether you can reject the hypothesis that the population slope, β, is 0 at the 5% significance level.Compute the value of the appropriate sample test statistic, tstat, and use it to reach the proper conclusion.
(Multiple Choice)
4.7/5  (31)
(31)
Karina Burkholtz believes there is a linear connection between the hourly rate (x) that her company charges for its truck rentals and the number of weekly rental hours (y) that the company sells.The following data are available: 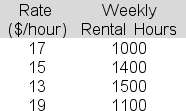 The slope term (b) in the estimated regression equation is -80.The intercept term (a) is 2530.Determine the value of the correlation coefficient R that you should enter in the indicated cell of the table below:

(Multiple Choice)
5.0/5 (35)
In a simple linear regression analysis attempting to relate sales (y) to price (x), the following data are available: 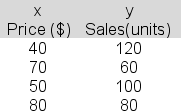 The least squares line would predict a y value of _______ for an x value of 60.
(Multiple Choice)
4.8/5 (29)
In a simple linear regression analysis attempting to link lottery sales (y) to jackpot amount (x), the following data are available: 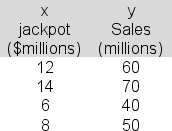 The slope (b) of the estimated regression equation here is 3.5.The intercept (a) is 20.Produce the 95% confidence interval estimate of the population slope, β, and report the upper bound for the interval.
(Multiple Choice)
4.8/5 (38)
A local shopping mall would like to better understand the effectiveness of its security guards in preventing shoplifting.The mall's operation manager uses simple linear regression to develop an equation that predicts the number of daily shoplifting incidents at the mall's stores based on the number of security guards employed.  The slope of the regression line is b = -1.2; the intercept of the regression line is a = 14.5.Compute the value of r, the correlation coefficient.
(Multiple Choice)
4.8/5 (26)
In a simple linear regression, the least squares line turns out to be y = 120 + 4x.The observed value of y when x = 10 is 182.The residual value for x = 10 must be 22.
(True/False)
4.8/5 (24)
A cell phone's SAR (Specific Absorption Rate) is a measure of the amount of radio frequency (RF) energy absorbed by the body when using a cell phone.The rate can vary by the distance of the phone from the ear.Below is a table showing SAR (y) and distance (x) for a sample of five 10 minute calls. 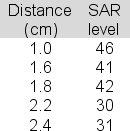 The slope of the least squares line is 59.6.The intercept is -12.Compute the "total variation" (SST).
(Multiple Choice)
5.0/5 (44)
The following data are available for a simple linear regression analysis attempting to link hours of training (x) to hourly output (y).  In applying the least squares criterion, the slope (b) and the intercept (a) for the best-fitting line are b = 2.4 and a = 3.6.You are to set up a hypothesis test to determine whether you can reject the hypothesis that the population slope, β, is 0 at the 5% significance level.Report the value of the appropriate sample test statistic, tstat.
(Multiple Choice)
4.8/5 (35)
Partial regression results from a sample of 24 observations are shown below.Determine the value of R, the correlation coefficient here. 

(Multiple Choice)
4.8/5 (31)
The manager of a local shopping mall uses simple linear regression to develop an equation that predicts the number of daily shoplifting incidents at the mall's stores based on the number of security guards employed.The manager uses the following data: 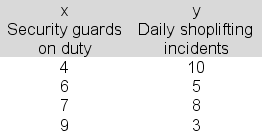 The slope of the regression line is b = -1.2; the intercept of the regression line is a = 14.5.
Use the results of the regression analysis to produce a 95% confidence interval for the expected number of shoplifting incidents when there are 5 security guards on duty.Based on the confidence interval, complete the following sentence:
With 95% confidence, the expected number of shoplifting incidents on days when there are 5 security guards on duty is between ______ and ______.
The slope of the regression line is b = -1.2; the intercept of the regression line is a = 14.5.
Use the results of the regression analysis to produce a 95% confidence interval for the expected number of shoplifting incidents when there are 5 security guards on duty.Based on the confidence interval, complete the following sentence:
With 95% confidence, the expected number of shoplifting incidents on days when there are 5 security guards on duty is between ______ and ______.
(Multiple Choice)
4.9/5 (32)
A regression analysis between demand (y in 1000 units) and price (x in $) resulted in the following equation: estimated Y = 9 - 5x.This equation implies that if the price is increased by $1, the demand is expected to
(Multiple Choice)
4.9/5 (37)
The following data are available for a simple linear regression analysis attempting to link hours of training (x) to hourly output (y). 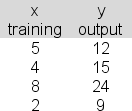 In applying the least squares criterion, the slope (b) and the intercept (a) for the best-fitting line are b = 2.4 and a = 3.6.Produce the 90% confidence interval estimate of the population slope, β.Report the upper bound for your interval.
(Multiple Choice)
4.9/5 (37)
Economist Joshua Grant is using linear regression to try to establish a link between the unemployment rate (x) and home sales in Lane County (y) during a given month.The following data are available: 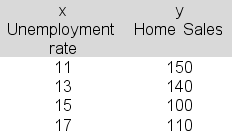 The slope term (b) in the estimated regression equation is -8.The intercept term (a) is 237.Compute the standard error of estimate (sy.x) here.
(Multiple Choice)
4.7/5 (30)
The regression printout below shows the results of a regression analysis intended to link company profits (x) to CEO salary (y).A sample of 18 CEOs was used. 

 Can you use the sample results shown here to reject a β = 0 null hypothesis at the 5% significance level? Explain.
(Multiple Choice)
4.9/5 (34)
Application of the least squares method to regression analysis results in values of the y intercept and the slope that minimizes the sum of the squared deviations between the:
(Multiple Choice)
4.9/5 (37)
If the correlation coefficient is a positive value, then the slope of the regression line:
(Multiple Choice)
4.9/5 (30)
In regression analysis, which of the following is NOT a required assumption about the error term, ?
(Multiple Choice)
5.0/5 (35)
You are attempting to link responses to a job announcement (y) to the number of days the announcement was repeated (x): 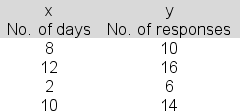 The slope term (b) in the estimated regression equation was 1.0.The intercept term (a) was 3.5.Show the 99% confidence interval estimate of the expected number of responses when the number of days the announcement is repeated is 11 and report the upper bound for the interval.
(Multiple Choice)
4.7/5 (37)
Filters
- Essay(0)
- Multiple Choice(0)
- Short Answer(0)
- True False(0)
- Matching(0)