Exam 11: Basic Regression Analysis
Exam 1: An Introduction to Statistics44 Questions
Exam 2: Descriptive Statistics I: Elementary Data Presentation and Description147 Questions
Exam 3: Descriptive Statistics II: Additional Descriptive Measures and Data Displays128 Questions
Exam 4: Probability147 Questions
Exam 5: Discrete Probability Distributions144 Questions
Exam 6: Continuous Probability Distributions141 Questions
Exam 7: Statistical Inference: Estimating a Population Mean134 Questions
Exam 8: Interval Estimates for Proportions, Mean Differences and Proportion Differences19 Questions
Exam 9: Statistical Hypothesis Testing: Hypothesis Tests for a Population Mean62 Questions
Exam 10: Hypothesis Tests for Proportions, Mean Differences and Proportion Differences39 Questions
Exam 11: Basic Regression Analysis111 Questions
Exam 12: Multiple Regression53 Questions
Exam 13: F Tests and Analysis of Variance95 Questions
Exam 14: Experimental Designonline Only64 Questions
Exam 16: Chi-Square Tests145 Questions
Select questions type
Partial regression results from a sample of 12 observations are shown below.Determine the upper bound on the 95% interval estimate of the population slope, β. 
(Multiple Choice)
4.8/5  (35)
(35)
Suppose you have done a simple linear regression analysis using a sample of 50 data points in an attempt to find a linear connection between worker overtime hours (x) and worker productivity (y) for employees of Sky Marketing Enterprises.The correlation coefficient turned out to be -.80. If total variation in y was 22500, then unexplained variation must be _______.
(Multiple Choice)
4.8/5 (23)
In simple linear regression, the variable that will be predicted is labeled the dependent variable.
(True/False)
4.8/5 (30)
Tennis coach Ben Gordon is trying to identify a linear relationship that can be used to link average first serve velocity to the percent of first serve points won for his junior tennis players.Below is a table showing velocity and percent of points won for a sample of five junior players. 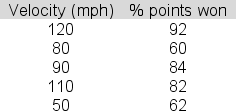 The slope of the least squares line is .44.The intercept is 36.4.Determine the value of R2, the coefficient of determination, that you would insert in the table below.

(Multiple Choice)
4.9/5 (41)
In simple linear regression, an r2 value of -.93 suggests that:
(Multiple Choice)
4.8/5 (35)
Suppose you have done a simple linear regression analysis using a sample of 50 data points in an attempt to find a linear connection between worker overtime hours (x) and worker productivity (y) for employees of Sky Marketing Enterprises.The correlation coefficient turned out to be -.80. If total variation in y was 22500, then explained variation (SSR) must be _____.
(Multiple Choice)
4.9/5 (36)
Application of the least squares method to regression analysis results in values of the y intercept and the slope that minimizes the sum of the squared deviations between the:
(Multiple Choice)
4.8/5 (37)
Larger values of r2 imply that the observations are more closely grouped about the:
(Multiple Choice)
4.9/5 (25)
The manager of a local shopping mall uses simple linear regression to develop an equation that predicts the number of daily shoplifting incidents at the mall's stores based on the number of security guards employed.Below is a partial table showing the data that was used. 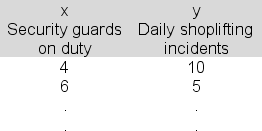 The slope of the regression line is b = -1.2; the intercept of the regression line is a = 14.5.
Calculate the residual associated with the first observation in the data set, where x = 4 and y = 10.
The slope of the regression line is b = -1.2; the intercept of the regression line is a = 14.5.
Calculate the residual associated with the first observation in the data set, where x = 4 and y = 10.
(Multiple Choice)
4.8/5 (33)
A local shopping mall would like to better understand the effectiveness of its security guards in preventing shoplifting.The mall's operation manager uses simple linear regression to develop an equation that predicts the number of daily shoplifting incidents at the mall's stores based on the number of security guards employed. 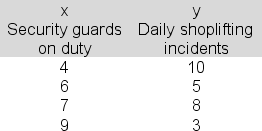 The slope of the regression line is b = -1.2; the intercept of the regression line is a = 14.5.Compute the value of the standard error of the estimate.
(Multiple Choice)
4.8/5 (38)
A regression analysis linking demand (y in 1000 units) and price (x in $) resulted in the following equation: estimated Y = 9 - 3x.This equation implies that if the price is decreased by $1, demand can be expected to:
(Multiple Choice)
4.7/5 (36)
Lillian Chernov is trying to identify a linear relationship that can be used to estimate the construction cost for a new sports complex that her construction company is bidding on.Below is a table showing construction costs and floor area for a sample of five similar buildings in the area. 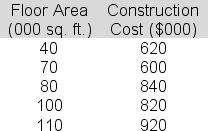 The slope for the least squares line is 4.4.The intercept is 408.Compute the "explained variation" (SSR) here.
(Multiple Choice)
4.8/5 (27)
In simple linear regression, rejecting the = 0 null hypothesis in the key hypothesis test means:
(Multiple Choice)
4.8/5 (34)
The regression printout below shows the results of a regression analysis intended to link company profits (x) to CEO salary (y).A sample of 18 CEOs was used.Based on the printout provided, what proportion of the variation in income CANNOT be explained by the profit-to-salary relationship represented by the estimated regression line? 


(Multiple Choice)
4.9/5 (44)
A National football League agent is conducting a simple linear regression study linking passes caught in a season (x) to annual salary (y) for wide receivers in the league.The data for five players are shown below.  The slope for the least squares line is 2.2.The intercept is 182.Compute the standard error of estimate (sy.x) here.
(Multiple Choice)
4.7/5 (35)
In simple regression, the usual goal is to identify a cause-and-effect relationship between two variables.
(True/False)
4.9/5 (37)
You are using linear regression to link number of responses to a job announcement (y) to the number of days the announcement was repeated (x): 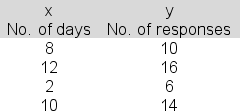 In applying the least squares criterion, the slope (b) and the intercept (a) for the best-fitting line are b = 1.0 and a = 3.5.Produce the 95% confidence interval estimate of the population intercept and report the upper bound for your interval.
(Multiple Choice)
4.8/5 (37)
The following data have been collected for a simple linear regression analysis:  In applying the least squares criterion, the slope (b) and the intercept (a) for the best-fitting line are b = 1.4 and a = .2.Compute the value of r2 here.
(Multiple Choice)
4.7/5 (41)
Preston Gomez is attempting to identify a linear relationship that will link heating and air conditioning costs to total floor area for his commercial properties.Below is a table showing heating /AC costs and floor area for five buildings in the area. 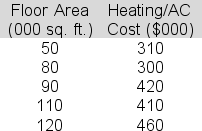 The computer output table below shows partial results for the linear regression analysis done here.Determine the upper bound on a 95% confidence interval estimate of the slope in the regression equation-a value that would be entered in the indicated cell of the output table.


(Multiple Choice)
4.9/5 (29)
Needing a simple cost estimator for commercial construction costs in the city, you hope to find a useful linear relationship between cost (y) and floor space (x).You have data from a sample of four recently completed building projects: 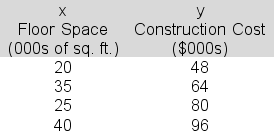 The estimated regression equation turns out to be y = 24 + 1.6x and sb= 1.13.Construct an appropriate hypothesis test to determine whether we can use the sample data here to reject a β = 0 null hypothesis at the 5% significance level.Report your conclusion.
(Multiple Choice)
4.8/5 (37)
Filters
- Essay(0)
- Multiple Choice(0)
- Short Answer(0)
- True False(0)
- Matching(0)