Exam 3: Demand and Supply
Exam 1: What Is Economics483 Questions
Exam 2: The Economic Problem440 Questions
Exam 3: Demand and Supply515 Questions
Exam 4: Elasticity530 Questions
Exam 5: Efficiency and Equity450 Questions
Exam 6: Government Actions in Markets412 Questions
Exam 7: Global Markets in Action205 Questions
Exam 8: Utility and Demand366 Questions
Exam 10: Organizing Production385 Questions
Exam 11: Output and Costs493 Questions
Exam 12: Perfect Competition487 Questions
Exam 13: Monopoly599 Questions
Exam 14: Monopolistic Competition318 Questions
Exam 15: Oligopoly276 Questions
Exam 16: Public Choices, Public Goods, and Healthcare205 Questions
Exam 17: Externalities437 Questions
Exam 18: Markets for Factors of Production382 Questions
Exam 19: Economic Inequality351 Questions
Exam 20: Uncertainty and Information233 Questions
Select questions type
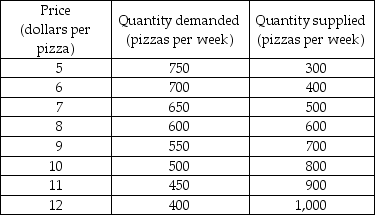 -A market research team has come up with the demand and supply schedules for pizza in Cheeseboro. These schedules are given in the table above. Use these data to analyze the situation in the market for pizza.
a) Draw a figure showing the demand curve for pizza and the supply curve of pizza. What are the equilibrium price and quantity?
b) Suppose the price is $10. Describe the situation in the market and explain how the price of pizza adjusts. Now suppose the price is $6. Describe the situation in the market and explain how the price of pizza adjusts.
c) The market research report also includes a prediction about the effect on the market for pizza in Cheeseboro of a recent news published in Cheeseboro Herald. The Herald reported that pizza has been discovered to help prevent heart diseases. Unfortunately, your dog chewed up the report and all you can read about the prediction is "quantity... by 150 at each price." What does the prediction say? Use your graph to show the predicted effects on the market for pizza. What are the predicted equilibrium price and quantity? How will the market adjust?
-A market research team has come up with the demand and supply schedules for pizza in Cheeseboro. These schedules are given in the table above. Use these data to analyze the situation in the market for pizza.
a) Draw a figure showing the demand curve for pizza and the supply curve of pizza. What are the equilibrium price and quantity?
b) Suppose the price is $10. Describe the situation in the market and explain how the price of pizza adjusts. Now suppose the price is $6. Describe the situation in the market and explain how the price of pizza adjusts.
c) The market research report also includes a prediction about the effect on the market for pizza in Cheeseboro of a recent news published in Cheeseboro Herald. The Herald reported that pizza has been discovered to help prevent heart diseases. Unfortunately, your dog chewed up the report and all you can read about the prediction is "quantity... by 150 at each price." What does the prediction say? Use your graph to show the predicted effects on the market for pizza. What are the predicted equilibrium price and quantity? How will the market adjust?
(Essay)
4.7/5  (39)
(39)
Leather belts and leather shoes are substitutes in production. If style changes increase the demand for leather belts, the supply curve of leather shoes will shift
(Multiple Choice)
4.7/5 (30)
Suppose that people find out that eating more fish improves their health, leading them to increase their demand for fish. As a result, the equilibrium price of fish ________ and the equilibrium quantity ________.
(Multiple Choice)
5.0/5 (39)
During the last decade, the price of a computer fell every year and the quantity sold increased every year. This experience suggests that the
(Multiple Choice)
4.9/5 (40)
What is the difference between a normal good and an inferior good? Give an example of each.
(Essay)
5.0/5 (40)
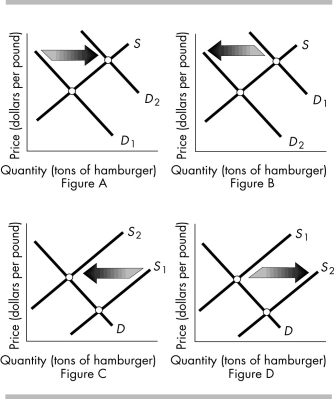 -The above figure shows the market for hamburger. Which figure shows the effect of an announcement by the U.S. Food and Drug Administration (FDA)that eating hamburger causes early death?
(Multiple Choice)
4.7/5 (24)
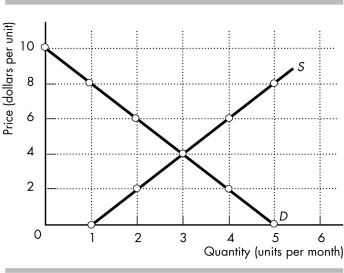 -In the figure above, if the price is $8 a unit, is there a shortage or surplus and what is the amount of any shortage or surplus? What is the equilibrium price and quantity?
(Essay)
4.8/5 (43)
An ice cream cone costs $1.50. A can of soda costs $0.75. The relative price of an ice cream cone is
(Multiple Choice)
4.9/5 (38)
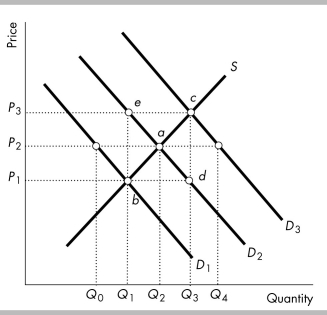 -In the above figure, if D2 is the original demand curve for a normal good and income decreases, which price and quantity might result?
(Multiple Choice)
4.8/5 (42)
In 2012 Nike reduced the price of its running shoes by 20 percent. As a result, the substitution effect caused
(Multiple Choice)
4.8/5 (31)
Cable television companies must pay increased charges by the networks for the programs the cable companies carry. As a result, the price of cable television rises. Thus
(Multiple Choice)
4.9/5 (36)
Your friend Tony opened a pizzeria. You helped him to advertise his pizza, which is in fact the best pizza in town. As a result, the demand for Tony's pizza increases and your friend, noticing lines of customers, raises the price of his pizza. But then he fears that the higher price will cause demand to decline, which will cause the price to drop. Is Tony right in his analysis of the situation? Explain.
(Essay)
4.8/5 (44)
The equilibrium quantity will decrease and the price might rise, fall, or stay the same when the
(Multiple Choice)
4.9/5 (31)
Filters
- Essay(0)
- Multiple Choice(0)
- Short Answer(0)
- True False(0)
- Matching(0)