Exam 3: Demand and Supply
Exam 1: What Is Economics483 Questions
Exam 2: The Economic Problem440 Questions
Exam 3: Demand and Supply515 Questions
Exam 4: Elasticity530 Questions
Exam 5: Efficiency and Equity450 Questions
Exam 6: Government Actions in Markets412 Questions
Exam 7: Global Markets in Action205 Questions
Exam 8: Utility and Demand366 Questions
Exam 10: Organizing Production385 Questions
Exam 11: Output and Costs493 Questions
Exam 12: Perfect Competition487 Questions
Exam 13: Monopoly599 Questions
Exam 14: Monopolistic Competition318 Questions
Exam 15: Oligopoly276 Questions
Exam 16: Public Choices, Public Goods, and Healthcare205 Questions
Exam 17: Externalities437 Questions
Exam 18: Markets for Factors of Production382 Questions
Exam 19: Economic Inequality351 Questions
Exam 20: Uncertainty and Information233 Questions
Select questions type
Which of the following shifts the supply curve for good X leftward?
(Multiple Choice)
4.8/5  (33)
(33)
If the price of lumber rises, then, in the market for sawdust
(Multiple Choice)
4.8/5 (29)
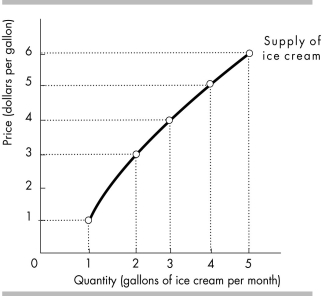 -In the above figure, what is the minimum supply price for the fourth gallon of ice cream?
(Multiple Choice)
4.8/5 (42)
Young drivers often buy used cars. An increase in the legal driving age to twenty-one shifts the demand curve for used cars leftward, whereas lowering the age to fifteen shifts the demand curve rightward.
(True/False)
4.8/5 (41)
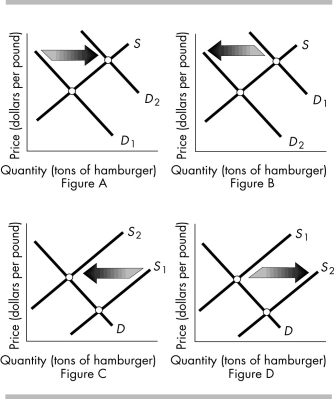 -The above figure shows the market for hamburger. Which panel shows the effect of a new excise tax on all beef products?
(Multiple Choice)
4.8/5 (35)
The price of a gallon of milk falls. Which of the following is a possible cause?
(Multiple Choice)
4.8/5 (42)
Changes in which of the following shifts the supply curve of hamburgers?
(Multiple Choice)
4.8/5 (36)
When people's incomes increase, the demand for a good increases. The good is called
(Multiple Choice)
4.8/5 (38)
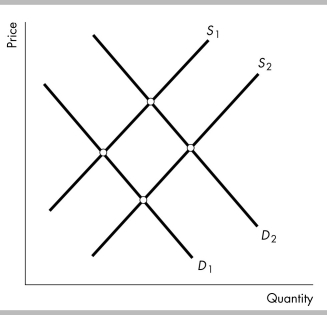
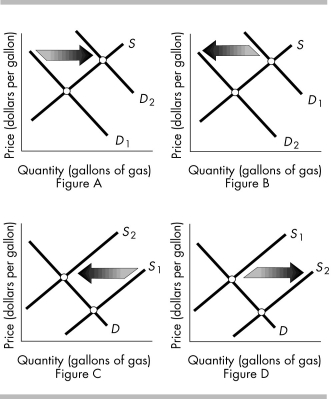 -The above figures show the market for gasoline. Which figure shows the effect of the end of a nine month strike by workers at all U.S. oil refineries?
(Multiple Choice)
4.9/5 (42)
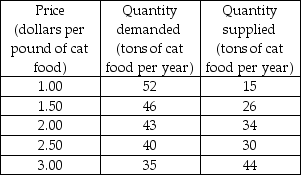 -The above table gives the demand and supply schedules for cat food. If the price is $3.00 per pound of cat food, will there be a shortage, a surplus, or is this price the equilibrium price? If there is a shortage, how much is the shortage? If there is a surplus, how much is the surplus? If $3.00 is the equilibrium price, what is the equilibrium quantity?
(Essay)
4.8/5 (37)
The money price of a pizza is $12 per pizza and the money price of a taco is $2 per taco. The relative price of a pizza is
(Multiple Choice)
4.8/5 (36)
 -The above figure shows the market for french fries at fast food joints. If the price of potatoes rises and simultaneously people become concerned that french fries can cause heart attacks the
(Multiple Choice)
4.9/5 (37)
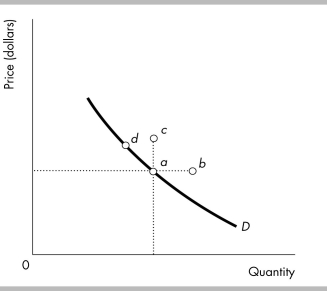 -In the above figure, an increase in the quantity demanded is represented by a movement from point d to
(Multiple Choice)
4.7/5 (35)
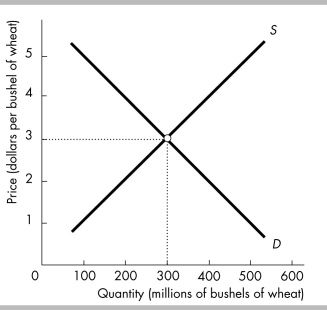 -In the figure, the equilibrium price is initially $3 per bushel of wheat. If suppliers come to expect that the price of a bushel of wheat will rise in the future, but buyers do not, the current equilibrium price will
(Multiple Choice)
4.8/5 (41)
If consumers but not producers expect that the price of soda will rise in November, the
(Multiple Choice)
4.8/5 (46)
Filters
- Essay(0)
- Multiple Choice(0)
- Short Answer(0)
- True False(0)
- Matching(0)