Exam 3: Demand and Supply
Exam 1: What Is Economics483 Questions
Exam 2: The Economic Problem440 Questions
Exam 3: Demand and Supply515 Questions
Exam 4: Elasticity530 Questions
Exam 5: Efficiency and Equity450 Questions
Exam 6: Government Actions in Markets412 Questions
Exam 7: Global Markets in Action205 Questions
Exam 8: Utility and Demand366 Questions
Exam 10: Organizing Production385 Questions
Exam 11: Output and Costs493 Questions
Exam 12: Perfect Competition487 Questions
Exam 13: Monopoly599 Questions
Exam 14: Monopolistic Competition318 Questions
Exam 15: Oligopoly276 Questions
Exam 16: Public Choices, Public Goods, and Healthcare205 Questions
Exam 17: Externalities437 Questions
Exam 18: Markets for Factors of Production382 Questions
Exam 19: Economic Inequality351 Questions
Exam 20: Uncertainty and Information233 Questions
Select questions type
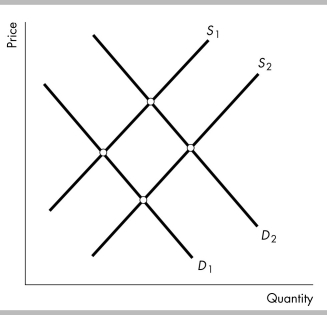
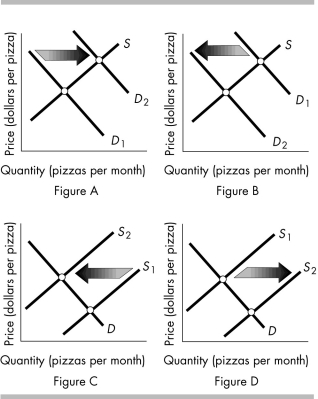 -The above figure shows the market for pizza. Which figure shows the effect of a decrease in the price of a hamburger, which for consumers is a substitute for pizza?
(Multiple Choice)
4.9/5  (42)
(42)
A bakery can produce either cakes or cookies. If the price of cookies rises, then
(Multiple Choice)
4.9/5 (48)
The Market for Wapanzo Beans
Quantity Demanded Price Quantity Supplied
(millions of pounds (dollars per (millions of pounds
per year) pound) per year)
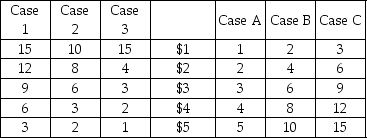 -Refer to the table above. Suppose that in normal years demand is represented by Case 2 and supply is represented by Case B. In a normal year the equilibrium quantity of wapanzo beans will be
(Multiple Choice)
4.8/5 (29)
Explain the difference between a change in demand and a change in quantity demanded. What leads to each of these changes?
(Essay)
4.8/5 (40)
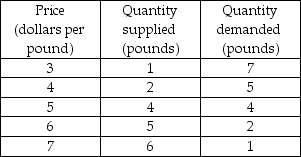 -The above table shows the demand schedule and supply schedule for chocolate chip cookies. If the price is $4.00 per pound, there is a
(Multiple Choice)
5.0/5 (38)
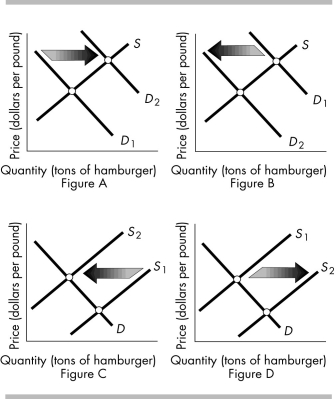 -The above figures show the market for hamburger meat. Which figure(s) shows the effect of an increase in the price of a hamburger bun, a complement for hamburger meat?
(Multiple Choice)
4.9/5 (33)
 -The above figure shows the market for gasoline. When a hurricane destroys a major refinery that refines oil into gasoline, the
(Multiple Choice)
4.9/5 (36)
-The above figures show the market for hamburger meat. Which figure(s) shows the effect of an increase in the price of a substitute like hot dogs?
(Multiple Choice)
4.9/5 (34)
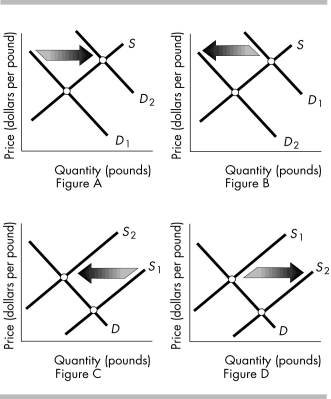 -The above figures show the market for oranges. Which figure(s) shows the effect of a new government program that provides each public school child with an orange to start the day?
(Multiple Choice)
4.9/5 (33)
The "law of supply" states that, other things remaining the same, firms produce
(Multiple Choice)
5.0/5 (40)
When there is a shortage in the market, the quantity sold is
(Multiple Choice)
4.9/5 (46)
-The above figures show the market for hamburger meat. Which figure shows the effect when more farmers decide to raise cows that are processed into hamburger meat?
(Multiple Choice)
4.8/5 (36)
If the demand and supply curves are described by the following equations P = a - bQ and P = c + dQ, respectively, the equilibrium price is P* = (ad + bc) / (b + d).
(True/False)
4.9/5 (39)
The equilibrium price will fall and the equilibrium quantity might increase, decrease, or stay the same when the
(Multiple Choice)
4.8/5 (33)
If there exists a shortage in the market for snowmobiles, then the price of a snowmobile will
(Multiple Choice)
4.8/5 (37)
Producers of DVDs are able to lower the wage rate that they pay to their workers. You predict that the
(Multiple Choice)
4.8/5 (34)
Filters
- Essay(0)
- Multiple Choice(0)
- Short Answer(0)
- True False(0)
- Matching(0)