Exam 3: Demand and Supply
Exam 1: What Is Economics483 Questions
Exam 2: The Economic Problem440 Questions
Exam 3: Demand and Supply515 Questions
Exam 4: Elasticity530 Questions
Exam 5: Efficiency and Equity450 Questions
Exam 6: Government Actions in Markets412 Questions
Exam 7: Global Markets in Action205 Questions
Exam 8: Utility and Demand366 Questions
Exam 10: Organizing Production385 Questions
Exam 11: Output and Costs493 Questions
Exam 12: Perfect Competition487 Questions
Exam 13: Monopoly599 Questions
Exam 14: Monopolistic Competition318 Questions
Exam 15: Oligopoly276 Questions
Exam 16: Public Choices, Public Goods, and Healthcare205 Questions
Exam 17: Externalities437 Questions
Exam 18: Markets for Factors of Production382 Questions
Exam 19: Economic Inequality351 Questions
Exam 20: Uncertainty and Information233 Questions
Select questions type
Which of the following decreases the supply of restaurant meals?
(Multiple Choice)
5.0/5  (43)
(43)
There is a technological advance in the production of a good and simultaneously also an increase in the expected future price. Which of the following will happen?
(Multiple Choice)
4.8/5 (34)
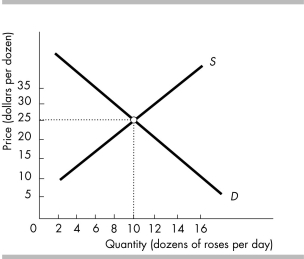 -In the above figure, a price of $35 per dozen would result in
(Multiple Choice)
4.9/5 (35)
Suppose we observe that both the equilibrium price of film cameras and the equilibrium quantity of film cameras have fallen. Which of the following could be responsible for this?
(Multiple Choice)
4.8/5 (31)
In 2014, the price of peanuts was rising, which lead peanut butter sellers and peanut butter buyers to expect the price of peanut butter would rise in the future. In the current market for peanut butter, the price rises and the quantity increases. This set of results means that
(Multiple Choice)
4.8/5 (40)
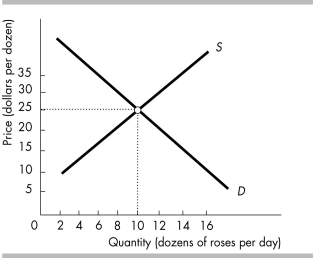 -Using the above figure, suppose there is a decrease in the number of suppliers. Then
(Multiple Choice)
4.9/5 (44)
Which of the following shifts the supply curve for gasoline rightward?
(Multiple Choice)
4.7/5 (36)
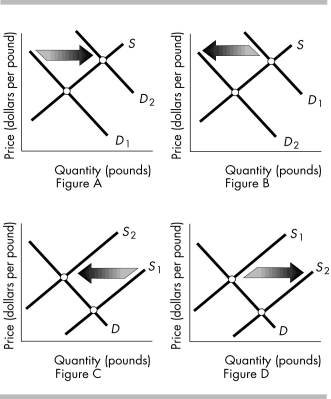 -The above figures show the market for oranges. Which figure shows the effect of changing consumer preferences for more orange juice and less coffee in the morning?
(Multiple Choice)
4.8/5 (30)
A consumer might consider in-line skates and elbow-pads to be
(Multiple Choice)
4.9/5 (33)
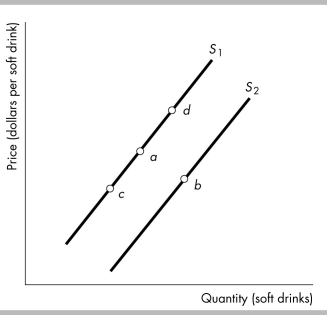 -The figure above shows supply curves for soft drinks. Suppose the economy is at point a. A decrease in the price of sugar used to make soft drinks is shown as a movement from point a to a point such as
(Multiple Choice)
4.9/5 (32)
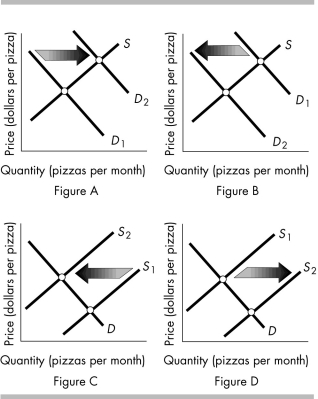 -The above figure shows the market for pizza. Which figure shows the effect of a new report by the U.S. Surgeon General that eating pizza lowers cholesterol levels, an outcome many people want?
(Multiple Choice)
4.8/5 (38)
There are 72,922 seats in Lambeau Field where the Green Bay Packers play football. The Packers have sold out their season tickets since 1960. There are about 80,000 people on the waiting list to buy season tickets in 2015. If the Packers raised ticket prices, the
(Multiple Choice)
4.7/5 (39)
What is the effect on the price and quantity of a product if both the demand and supply simultaneously increase?
(Essay)
4.8/5 (28)
Students can rent a Blu-ray movie at Campus Video for $4. As the price of Blu-ray players fall, the
(Multiple Choice)
4.8/5 (28)
In 2014, the price of peanuts was rising, which lead peanut butter sellers and peanut butter buyers to expect the price of peanut butter would rise in the future. Suppose the effect on the sellers was larger than the effect on the buyers. Consequently, in the current market for peanut butter there is a ________ in the price of peanut butter and ________ in the quantity of peanut butter.
(Multiple Choice)
4.7/5 (34)
For a "change in the quantity supplied" but not "a change in supply" to occur, there must be a
(Multiple Choice)
5.0/5 (38)
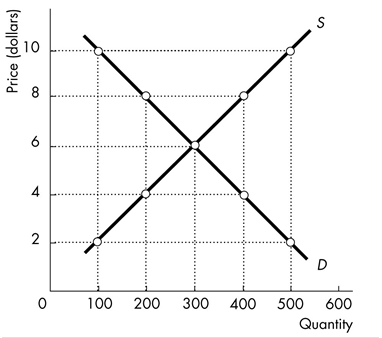 -The initial supply and demand curves for a good are illustrated in the above figure. If there is a rise in the price of a factor of production used to produce the good, then the new equilibrium price
(Multiple Choice)
4.8/5 (39)
Suppose the equilibrium price of a gallon of gasoline drops from $3.00 to $2.85 and the equilibrium quantity increases from 365 millions of gallons per week to 372 millions of gallons per week. These changes can be the result of
(Multiple Choice)
4.8/5 (29)
Filters
- Essay(0)
- Multiple Choice(0)
- Short Answer(0)
- True False(0)
- Matching(0)