Exam 3: Demand and Supply
Exam 1: What Is Economics483 Questions
Exam 2: The Economic Problem440 Questions
Exam 3: Demand and Supply515 Questions
Exam 4: Elasticity530 Questions
Exam 5: Efficiency and Equity450 Questions
Exam 6: Government Actions in Markets412 Questions
Exam 7: Global Markets in Action205 Questions
Exam 8: Utility and Demand366 Questions
Exam 10: Organizing Production385 Questions
Exam 11: Output and Costs493 Questions
Exam 12: Perfect Competition487 Questions
Exam 13: Monopoly599 Questions
Exam 14: Monopolistic Competition318 Questions
Exam 15: Oligopoly276 Questions
Exam 16: Public Choices, Public Goods, and Healthcare205 Questions
Exam 17: Externalities437 Questions
Exam 18: Markets for Factors of Production382 Questions
Exam 19: Economic Inequality351 Questions
Exam 20: Uncertainty and Information233 Questions
Select questions type
 -The above figure shows the market for bicycles. When there is a physical fitness craze so that everyone wants to exercise the
(Multiple Choice)
4.8/5  (34)
(34)
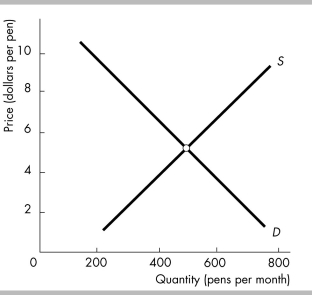 -The figure illustrates the market for pens. The equilibrium quantity is
(Multiple Choice)
4.8/5 (32)
Which of the following does NOT shift the demand curve for broccoli?
(Multiple Choice)
4.8/5 (34)
The quantity of CDs that firms plan to sell this month depends on all of the following except the
(Multiple Choice)
4.8/5 (43)
Which of the following shifts the supply curve for oranges?
(Multiple Choice)
4.7/5 (45)
Computers are a complement to computer software. Suppose the price of a computer falls. Simultaneously, suppose that the number of companies selling computer software decreases. How do these changes affect the price and quantity of computer software?
(Essay)
4.9/5 (46)
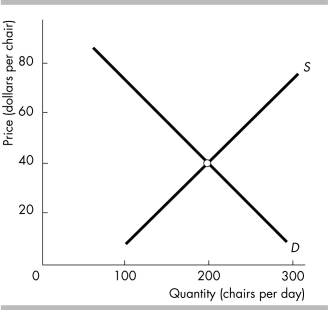 -The figure illustrates the market for chairs. If the supply of chairs increases, the price of a chair ________ $40 and the quantity ________.
(Multiple Choice)
4.7/5 (31)
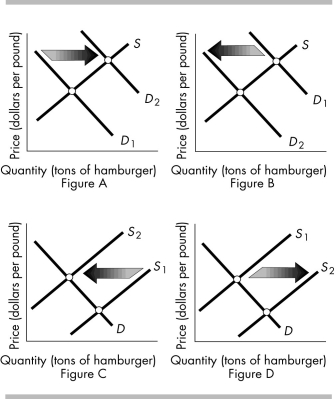 -The above figures show the market for hamburger meat. Which figure(s) shows the effect of a decrease in the price of a hamburger complement such as hamburger buns?
(Multiple Choice)
4.8/5 (40)
People buy more of good 1 when the price of good 2 rises. These goods are
(Multiple Choice)
4.8/5 (41)
When graphing a demand curve for corn, we are showing the relationship between the quantity demanded of corn and the
(Multiple Choice)
4.9/5 (36)
Ticket scalpers at the NCAA basketball tournament last year charged prices high above the printed ticket price. This observation is evidence of
(Multiple Choice)
4.8/5 (44)
If the price of chicken falls, then in the market for beef
(Multiple Choice)
4.7/5 (39)
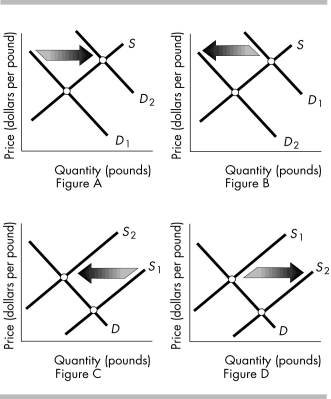 -The above figures show the market for oranges. Which figure(s) shows the effect of existing orange growers increasing the size of their orange groves?
(Multiple Choice)
4.8/5 (25)
-The above figures show the market for hamburger meat. Which figure(s) shows the effect of a new report by the U.S. Surgeon General that beef consumption is healthier than previously believed?
(Multiple Choice)
4.9/5 (36)
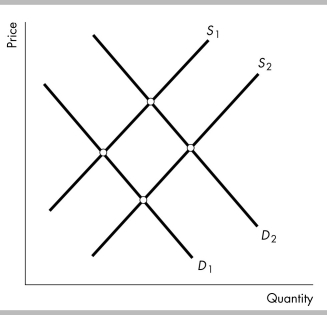
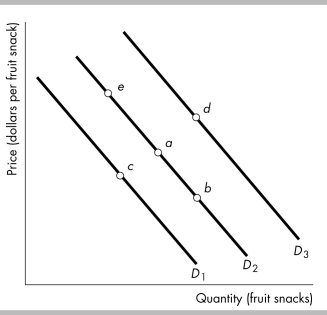 -The figure above shows the demand for fruit snacks. Which movement reflects an increase in the price of a substitute for fruit snacks?
(Multiple Choice)
4.9/5 (40)
-The above figures show the market for hamburger meat. Which figure(s) shows the effect of an increase in the number of people who eat hamburger meat?
(Multiple Choice)
4.9/5 (36)
A decrease in quantity demanded because of an increase in price is represented by a
(Multiple Choice)
4.9/5 (38)
Filters
- Essay(0)
- Multiple Choice(0)
- Short Answer(0)
- True False(0)
- Matching(0)