Exam 13: Correlation and Linear Regression
Exam 1: Why Study Statistics11 Questions
Exam 2: An Introduction to Statistics and Statistical Inference53 Questions
Exam 3: Tables and Graphs for Summarizing Data28 Questions
Exam 4: Numerical Summary Measures34 Questions
Exam 5: Probability54 Questions
Exam 6: Random Variables and Discrete Probability Distributions23 Questions
Exam 7: Continuous Probability Distributions45 Questions
Exam 8: Sampling Distributions50 Questions
Exam 9: Confidence Intervals Based on a Single Sample51 Questions
Exam 10: Hypothesis Tests Based on a Single Sample65 Questions
Exam 11: Confidence Intervals and Hypothesis Tests Based on Two Samples or Treatments45 Questions
Exam 12: The Analysis of Variance12 Questions
Exam 13: Correlation and Linear Regression57 Questions
Exam 14: Categorical Data and Frequency Tables23 Questions
Exam 15: Nonparametric Statistics66 Questions
Select questions type
Ten used cars from a rental fleet are randomly selected.Each vehicle's annual maintenance cost from the previous calendar year (y) is recorded as well as the vehicle's current mileage (x).A simple linear regression is conducted on the data.
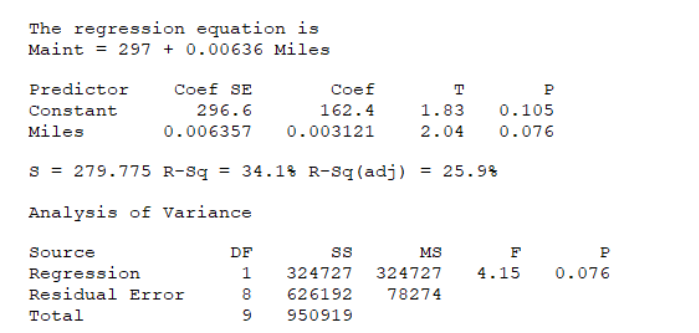
What is a 98% confidence interval for the mean annual repair cost of all used vehicles with 22,500 miles.=> (Given: Sxx= 8,036,677,024 and
What is a 98% confidence interval for the mean annual repair cost of all used vehicles with 22,500 miles.=> (Given: Sxx= 8,036,677,024 and  = $43,627.700.)
(Multiple Choice)
4.7/5  (24)
(24)
This histogram shows residuals from a simple linear regression: 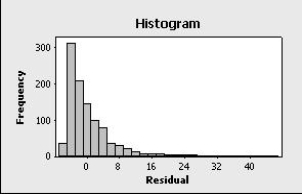 It appears that:
(Multiple Choice)
4.9/5 (29)
Ten used cars from a rental fleet are randomly selected.Each vehicle's annual maintenance cost from the previous calendar year (y) is recorded as well as the vehicle's current mileage (x).A simple linear regression is conducted on the data.
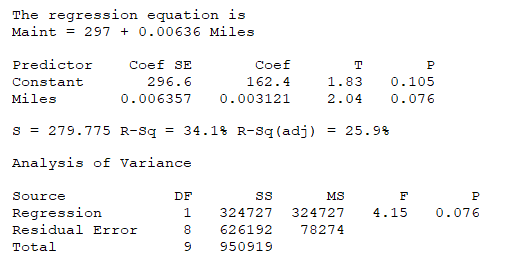 Conduct a test of hypothesis to see if there is sufficient evidence to conclude that used vehicles with 22,500 miles will have a mean annual maintenance cost that exceeds $400.Select the appropriate critical value (CV), test statistic (TS), and decision.(Use α = 0.05).(Given: Sxx= 803,667,7024 and
  = $43,627.700.)
(Multiple Choice)
4.9/5 (36)
In a simple linear regression analysis, the standard error of the slope is:
(Multiple Choice)
4.7/5 (36)
The regression equation is y1 = 0.33 + 0.866 x1
Based on this regression summary, what is r2?
Based on this regression summary, what is r2?
(Multiple Choice)
4.9/5 (33)
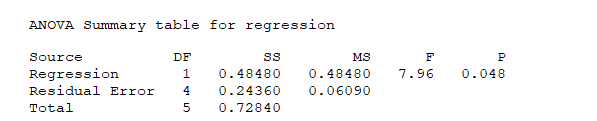
We record the amount of time (xin minutes) per day that a group of 12 high school students spend using their cell phone (texting, talking, and web use).We also record the overall GPA (y) of each student.Following is a regression summary for these data:
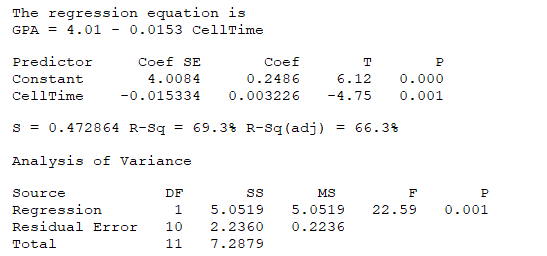
What is a 90% confidence interval for β0, the mean GPA of high school students who spent no time using their cell phone?
What is a 90% confidence interval for β0, the mean GPA of high school students who spent no time using their cell phone?
(Multiple Choice)
4.7/5 (38)
Factors A and B show a correlation of 0.95.This means that:
(Multiple Choice)
4.8/5 (43)
If all the values of an independent variable x are equal, then performing a simple linear regression on a dependent variable y will result in a coefficient of determination that is equal to:
(Multiple Choice)
4.9/5 (31)
In a deterministic relationship between two variables x and y of the form  it is understood that:
(Multiple Choice)
4.9/5 (37)
The amount of variability explained by the regression model is:
(Multiple Choice)
4.9/5 (32)
Concerning the simple linear regression model, SST can be expressed as:
(Multiple Choice)
4.9/5 (34)
Based on the following scatter plot of age versus blood pressure, which of the regression assumptions may be violated? 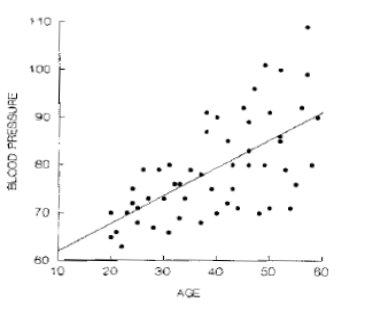
(Multiple Choice)
4.8/5 (30)
In simple linear regression, the plot of residuals versus fitted values can be used to check for:
(Multiple Choice)
4.8/5 (26)
Assume a least-squares regression line is found to be y = -5.73 + 0.282x.The coefficient of determination for these data is 0.64.What is the correlation coefficient?
(Multiple Choice)
4.9/5 (37)
A simple linear regression between y (weight in pounds) and x (height in inches) results in the following least-squares line: y = 128 + 6x.This tells us that if the height is increased by 1 in, then.on average.the weight is predicted to:
(Multiple Choice)
4.8/5 (36)
The linear relationship  (where
  and
and  are constants) is an example of:
(Multiple Choice)
4.8/5 (41)
Filters
- Essay(0)
- Multiple Choice(0)
- Short Answer(0)
- True False(0)
- Matching(0)