Exam 13: Correlation and Linear Regression
Exam 1: Why Study Statistics11 Questions
Exam 2: An Introduction to Statistics and Statistical Inference53 Questions
Exam 3: Tables and Graphs for Summarizing Data28 Questions
Exam 4: Numerical Summary Measures34 Questions
Exam 5: Probability54 Questions
Exam 6: Random Variables and Discrete Probability Distributions23 Questions
Exam 7: Continuous Probability Distributions45 Questions
Exam 8: Sampling Distributions50 Questions
Exam 9: Confidence Intervals Based on a Single Sample51 Questions
Exam 10: Hypothesis Tests Based on a Single Sample65 Questions
Exam 11: Confidence Intervals and Hypothesis Tests Based on Two Samples or Treatments45 Questions
Exam 12: The Analysis of Variance12 Questions
Exam 13: Correlation and Linear Regression57 Questions
Exam 14: Categorical Data and Frequency Tables23 Questions
Exam 15: Nonparametric Statistics66 Questions
Select questions type
A study is designed to evaluate the relationship between a person's height and his or her salary.A random sample of 800 workers at a large corporation is drawn, and each individual's height (x) and salary (y) are recorded.If the coefficient of determination from the sample is 0.126, we can conclude that:
(Multiple Choice)
4.9/5  (34)
(34)
Consider these five x, y pairs. 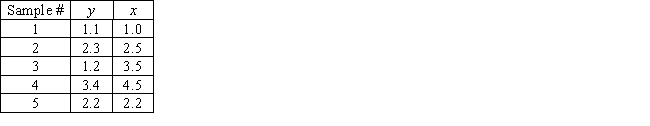
The regression equation is
The regression equation is 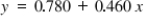 What is
  ?
?
(Multiple Choice)
4.8/5 (42)
From a random sample of n = 6 college students, a school counselor obtained the students' high school GPAs (x) and their college GPAs (y).Using these data, she wishes to develop a model that will allow her to predict a student's college GPA from his or her high school GPA. 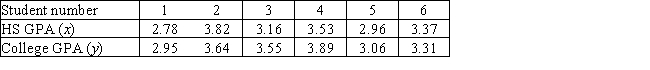
What is the fitted least-squares regression equation?
What is the fitted least-squares regression equation?
(Multiple Choice)
4.9/5 (44)
The least-squares method for determining the best fit minimizes the:
(Multiple Choice)
4.8/5 (25)
In the late 1890s, scientists first noted that the frequency of a cricket's chirps is related to air temperature.For each of 30 crickets, the frequency of chirping (in chirps per minute) and the air temperature (in degrees Fahrenheit) were recorded, and a regression analysis was performed.
 Given that Sxx= 14,497.9 and
  117.067, what is a 95% confidence interval for the mean air temperature when a cricket is chirping at a frequency of 120 chirps per minute?
(Multiple Choice)
4.8/5 (26)
Which value of the correlation coefficient r indicates a stronger correlation than 0.72?
(Multiple Choice)
4.8/5 (36)
Consider the following regression summary:
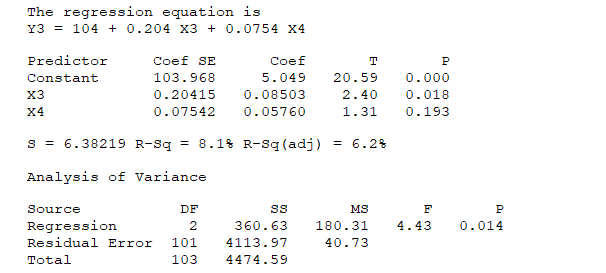 What proportion of the Y3 variability is explained by the model?
(Multiple Choice)
4.7/5 (40)
Consider the following regression analysis for predicting sales per week from intelligence and extroversion scores:
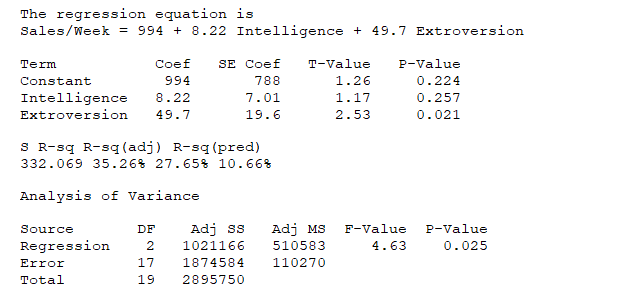 What proportion of the variability in sales per week is explained by the model?
(Multiple Choice)
4.9/5 (41)
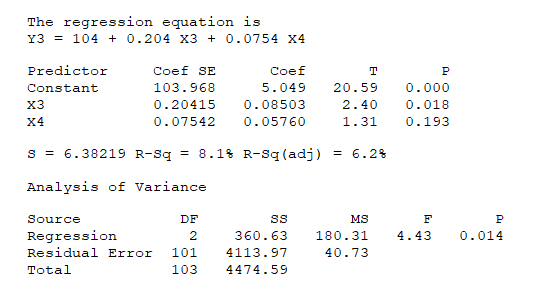
Medical researchers conducted a study designed to evaluate the relationship between blood pressure (y), age (x1), and cholesterol (x2).They proposed a linear model.A total of 126 individuals were randomly sampled, and blood pressure, age, and cholesterol were recorded for each.The regression summary appears here:
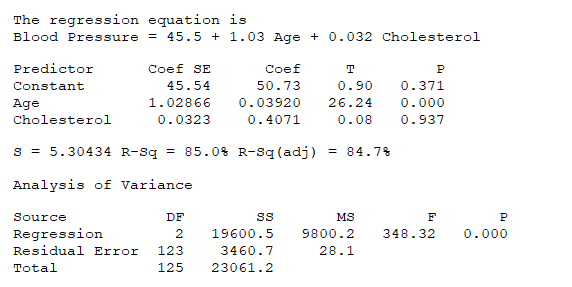 Which predictor (if any) does not appear to be linearly correlated with blood pressure? Which reason supports your answer?
(Multiple Choice)
4.8/5 (33)
Consider the following regression analysis for predicting sales per week from intelligence and extroversion scores:
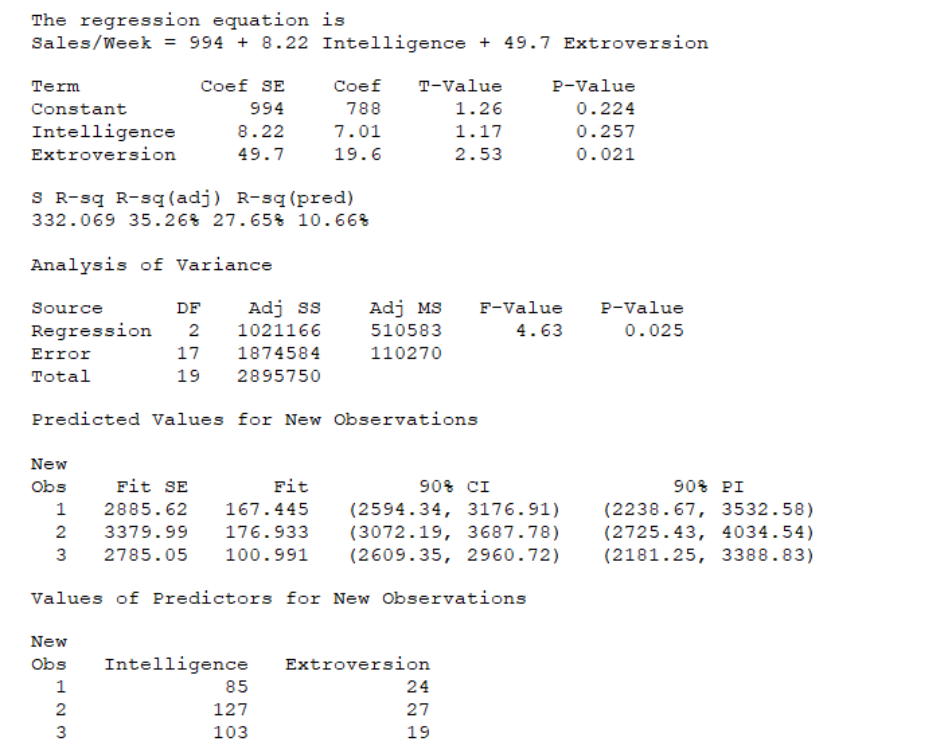 What is a 90% confidence interval for the average sales per week for all people with an intelligence score of 103 and an extroversion score of 19?
(Multiple Choice)
4.7/5 (38)
Which of the following is NOT an assumption for the simple linear regression model?
(Multiple Choice)
4.7/5 (27)
Is it always possible to do a linear best fit to a data set?
(Multiple Choice)
4.9/5 (37)
Consider the following regression summary:
 Perform a global utility test for the model.State the correct decision and reasoning.(Use α = 0.01.)
(Multiple Choice)
4.8/5 (31)
If the correlation coefficient r is 0.81, what percentage of variation in the dependent variable is explained by a linear regression with the independent variable?
(Multiple Choice)
4.8/5 (47)
According to the spurious correlations website (https://www.tylervigen.com/spurious-correlations), there is a 0.985065 correlation from 2000 to 2009 between revenue from arcade games and the number of computer science doctorates awarded in the United States.Assuming this correlation reflects a real cause-effect relationship, what is a possible link between these two factors?
(Multiple Choice)
4.9/5 (38)
What is the difference between a general additive probabilistic model and a general deterministic model?
(Multiple Choice)
4.7/5 (34)
Filters
- Essay(0)
- Multiple Choice(0)
- Short Answer(0)
- True False(0)
- Matching(0)