Exam 11: Confidence Intervals and Hypothesis Tests Based on Two Samples or Treatments
Exam 1: Why Study Statistics11 Questions
Exam 2: An Introduction to Statistics and Statistical Inference53 Questions
Exam 3: Tables and Graphs for Summarizing Data28 Questions
Exam 4: Numerical Summary Measures34 Questions
Exam 5: Probability54 Questions
Exam 6: Random Variables and Discrete Probability Distributions23 Questions
Exam 7: Continuous Probability Distributions45 Questions
Exam 8: Sampling Distributions50 Questions
Exam 9: Confidence Intervals Based on a Single Sample51 Questions
Exam 10: Hypothesis Tests Based on a Single Sample65 Questions
Exam 11: Confidence Intervals and Hypothesis Tests Based on Two Samples or Treatments45 Questions
Exam 12: The Analysis of Variance12 Questions
Exam 13: Correlation and Linear Regression57 Questions
Exam 14: Categorical Data and Frequency Tables23 Questions
Exam 15: Nonparametric Statistics66 Questions
Select questions type
When you are testing whether two population means of two normally distributed populations differ and the population variances are both unknown but unequal, the t test statistics will usually have a non-integer number of degrees of freedom v.In this case, you should:
(Multiple Choice)
4.7/5  (30)
(30)
Concerning inference on two independent population means, which of the following assumptions must be met for the pooled variance estimate to be appropriate?
(Multiple Choice)
4.8/5 (27)
Which of the following is NOT a property of the F distribution?
(Multiple Choice)
5.0/5 (41)
Which of the following options would serve as an intuitive estimate of the parameter  ?
?
(Multiple Choice)
4.8/5 (37)
A psychologist is studying the effect of belly stars on Sneetches.A random sample of four Sneetches is drawn, and a test of self-image is given to each Sneetch before and after having the belly star status changed.(If the Sneetch initially had a star, it was removed; if it did not have a star, one was created on the Sneetch using the patented "Star-off/Star-on" procedure.) From the following sample data, construct a 98% confidence interval on the population mean change in self-image associated with a star status change. 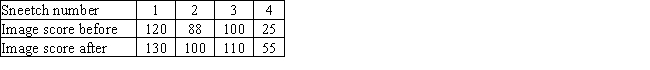
(Multiple Choice)
4.8/5 (27)
In 1993, Toyota introduced the Supra sports car, which was designed to have 320 horsepower in stock configuration.A computer chip modification for the fuel injection system was later introduced that was claimed to increase horsepower.To check whether the chip actually does increase horsepower, we sample six stock 1993 Supras and record each vehicle's horsepower (the results appear below). 
Next, technicians install the computer chip in each of the six vehicles' electronic injection systems and then record the horsepower of each (the results appear below).
Next, technicians install the computer chip in each of the six vehicles' electronic injection systems and then record the horsepower of each (the results appear below).

Does it appear that there is an average horsepower increase associated with the chip modification? Select the appropriate critical value (CV), test statistic (TS), and decision.(Use α = 0.05).
Does it appear that there is an average horsepower increase associated with the chip modification? Select the appropriate critical value (CV), test statistic (TS), and decision.(Use α = 0.05).
(Multiple Choice)
4.9/5 (38)
The pooled estimate for the common variance,  is the weighted average of the two sample variances, where the weights are determined by:
(Multiple Choice)
4.8/5 (28)
At the end of a 52-week study to determine how to help smokers quit, subjects were randomly placed into a nicotine lozenge group or a placebo group.To determine if the randomization was effective, the proportion of males in each group was obtained.The researchers found that 42.9% of the 459 subjects given the nicotine lozenge were males, and 40.2% of the 458 subjects given the placebo were males.Determine the p-value and test decision for determining if the proportion of males in the two groups differed.Use α = 0.05.
(Multiple Choice)
4.8/5 (34)
In developing a confidence interval estimate for the difference between two population means when the population variances are known, an increase in the size of the samples will result in:
(Multiple Choice)
4.7/5 (31)
Which of the following options would serve as an intuitive estimate of the parameter  ?
?
(Multiple Choice)
4.8/5 (28)
Which of the following statements is true about the F distribution?
(Multiple Choice)
4.9/5 (38)
If the process of selecting individuals or objects in sample 1 has no effect on, or no relation to, the selection of individuals or objects in sample 2, the samples are:
(Multiple Choice)
4.9/5 (37)
We wish to conduct a test of hypothesis on two independent population means.The objective of the test is to determine if the means are the same or if they differ.Both populations are assumed to be normal with equal variance.We draw 10 observations for the first sample and 20 observations for the second sample.What would be the appropriate critical value for the test if α = 0.01?
(Multiple Choice)
4.8/5 (35)
Which of the following is NOT a required assumption for constructing a confidence interval to estimate the difference between two population means when the sample sizes are small (less than 30)?
(Multiple Choice)
4.9/5 (38)
College admissions administrators at a university are reevaluating their entrance requirements.They believe that the mean GPA for graduating high school seniors has increased dramatically over the last decade.They randomly sample 85 records of graduating seniors from 10 years ago (sample 1) and find an average GPA of 2.68.An independent random sample of 80 current graduating seniors yields an average GPA of 2.94.If the population variance of high school GPAs is 0.2601, find a 95% confidence interval for the difference in population mean GPA over the last decade.
(Multiple Choice)
4.8/5 (26)
College admissions administrators at a university are reevaluating their entrance requirements.They believe that the mean GPA for graduating high school seniors has increased dramatically over the last decade.They randomly sample 85 records of graduating seniors from 10 years ago (sample 1) and find an average GPA of 2.68.An independent random sample of 80 current graduating seniors yields an average GPA of 2.94.If the population variance of high school GPAs is 0.2601, does it appear that there was an increase in mean GPA over the last decade? Select the correct p-value and decision below.Use α = 0.01.Also, state H₀.
(Multiple Choice)
4.8/5 (31)
To study the effect of soothing music on a person's blood pressure, two random samples of 220 adults were taken.One sample (sample 1) listened to soothing music for 5 min prior to having their blood pressure taken, while the other sample (sample 2) sat in silence.From previous studies, it was found that both populations have a standard deviation of 39.18.The average systolic blood pressure from the music sample was 114.5.The average systolic blood pressure from the silent sample was 122.8.Construct a 98% confidence interval on the difference in population mean blood pressures (music - silent).
(Multiple Choice)
5.0/5 (38)
Filters
- Essay(0)
- Multiple Choice(0)
- Short Answer(0)
- True False(0)
- Matching(0)