Exam 17: Statistics and Probability Questions
Exam 1: The Role of Statistics and the Data Analysis Process20 Questions
Exam 2: Collecting Data Sensibly28 Questions
Exam 3: Graphical Methods for Describing Data19 Questions
Exam 4: Numerical Methods for Describing Data21 Questions
Exam 5: Summarizing Bivariate Data17 Questions
Exam 6: Probability17 Questions
Exam 7: Random Variables and Probability Distributions20 Questions
Exam 8: Sampling Variability and Sampling Distributions16 Questions
Exam 9: Estimation Using a Single Sample20 Questions
Exam 10: Hypothesis Testing Using a Single Sample19 Questions
Exam 11: Comparing Two Populations or Treatments16 Questions
Exam 12: The Analysis of Categorical Data and Goodness-Of-Fit Tests9 Questions
Exam 13: Simple Linear Regression and Correlation: Inferential Methods22 Questions
Exam 14: Multiple Regression Analysis28 Questions
Exam 15: Analysis of Variance12 Questions
Exam 17: Statistics and Probability Questions152 Questions
Select questions type
The term used to describe the bias that occurs if some segment of a population is systematically excluded from a sample is
(Multiple Choice)
4.9/5  (40)
(40)
Use the following information for questions
One thousand students at a city high school were classified both according to GPA and
whether or not they consistently skipped classes.Here are the breakdowns: 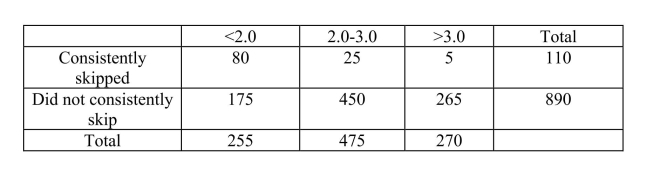 -What is the probability that a randomly selected student has a GPA under 2.0 and has consistently skipped classes?
(Multiple Choice)
4.7/5 (30)
When constructing a 95% confidence interval, the confidence level is: 
(Not Answered)
This question doesn't have any answer yet
A characteristic whose value may change from one individual to another is a:
(Multiple Choice)
4.8/5 (42)
The proportion of values in a normal population distribution that fall within 2 standard deviations of the mean is: 
(Not Answered)
This question doesn't have any answer yet
An experiment is a planned intervention undertaken to observe the effects of
(Multiple Choice)
4.8/5 (41)
The fit of the data indicates that on average the estimates of the logs of the proportion returning are declining as the logarithm of the distance increases. The number in the table that indicates this is:
(Multiple Choice)
4.7/5 (41)
In a randomized block design with 4 treatments and 3 blocks there are
(Multiple Choice)
4.9/5 (38)
The slope of the regression line and the correlation between two variables is related in the following way:
(Multiple Choice)
4.9/5 (41)
In a study of male / female differences in carnivores, the height of the canine teeth in the
lower jaws were measured.The data below are graphic representations of these data.
Use these graphs to answer questions below. 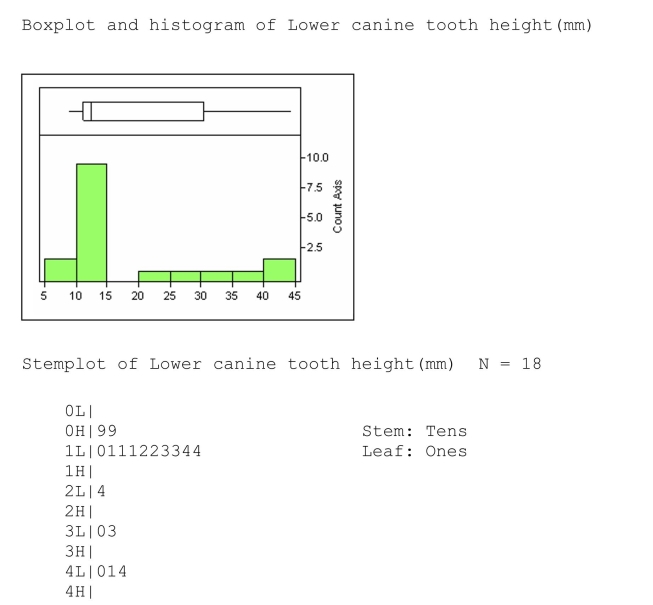 -The median of the lower canine tooth heights is:
(Not Answered)
This question doesn't have any answer yet
The single number in the computer output above that will indicate whether the null hypothesis should be rejected at the .05 level is: 
(Not Answered)
This question doesn't have any answer yet
A huge trucking firm determines that its fleet of trucks averages a mean of 12.4 miles per gallon with a standard deviation of 1.2 miles per gallon on cross-country hauls. The distribution of miles per gallon is approximately normally distributed.What is the probability that a randomly selected truck averages fewer than 10 miles per gallon?
(Multiple Choice)
4.8/5 (34)
In polling voter opinions about a school bond issue, two groups randomly sampled the population of River City.Both polls agree that the proportion of voters' who say they would vote "yes" is 0.84.However, the school district's research dept reports a margin of error of .025, while a citizens' group reports a margin of error of .03. Which of the reasons below, if any, might explain this discrepancy?
(Multiple Choice)
4.9/5 (37)
Filters
- Essay(0)
- Multiple Choice(0)
- Short Answer(0)
- True False(0)
- Matching(0)