Exam 17: Statistics and Probability Questions
Exam 1: The Role of Statistics and the Data Analysis Process20 Questions
Exam 2: Collecting Data Sensibly28 Questions
Exam 3: Graphical Methods for Describing Data19 Questions
Exam 4: Numerical Methods for Describing Data21 Questions
Exam 5: Summarizing Bivariate Data17 Questions
Exam 6: Probability17 Questions
Exam 7: Random Variables and Probability Distributions20 Questions
Exam 8: Sampling Variability and Sampling Distributions16 Questions
Exam 9: Estimation Using a Single Sample20 Questions
Exam 10: Hypothesis Testing Using a Single Sample19 Questions
Exam 11: Comparing Two Populations or Treatments16 Questions
Exam 12: The Analysis of Categorical Data and Goodness-Of-Fit Tests9 Questions
Exam 13: Simple Linear Regression and Correlation: Inferential Methods22 Questions
Exam 14: Multiple Regression Analysis28 Questions
Exam 15: Analysis of Variance12 Questions
Exam 17: Statistics and Probability Questions152 Questions
Select questions type
In a study of male / female differences in carnivores, the height of the canine teeth in the
lower jaws were measured.The data below are graphic representations of these data.
Use these graphs to answer questions below. 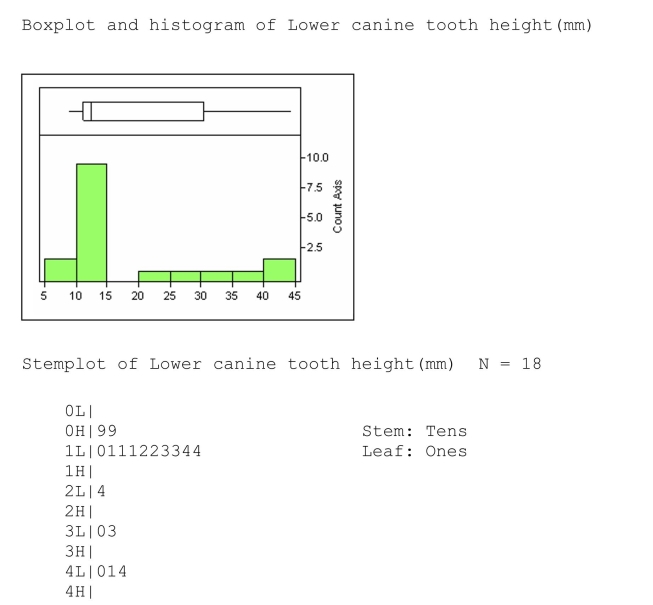 -When constructing a modified box plot, one must find the upper and lower mild outlier cutoffs.For these data, the upper mild outlier cutoff would be:
(Not Answered)
This question doesn't have any answer yet
For this null hypothesis, the test statistic is based on how many degrees of freedom?
(Multiple Choice)
4.8/5  (32)
(32)
Suppose that x has a probability distribution with density function 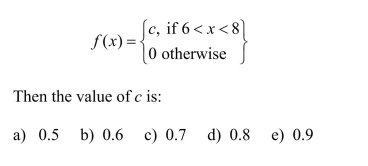
(Not Answered)
This question doesn't have any answer yet

 Questions 50 - 51 are based on the following information:
(Not Answered)
This question doesn't have any answer yet
Suppose I have a set of data with 5 numbers: -6.0, -4.5, 0, 5.0, and an unknown 5th number.For these 5 data points, which of the following statistics can NEVER be greater than zero?
(Multiple Choice)
4.8/5 (30)
When making inferences about population characteristics, it is always necessary that: 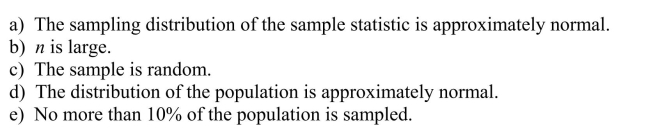
(Not Answered)
This question doesn't have any answer yet
In a study of hatchling resting metabolism, the yolk-free dry body mass for different
species of birds was gathered.A histogram of this data and possible box plots are shown
below, with numeric scales deleted. 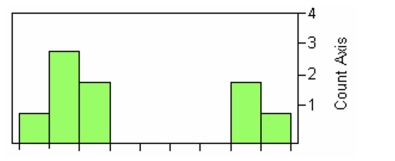 -Of the following boxplots, which best matches the histogram?
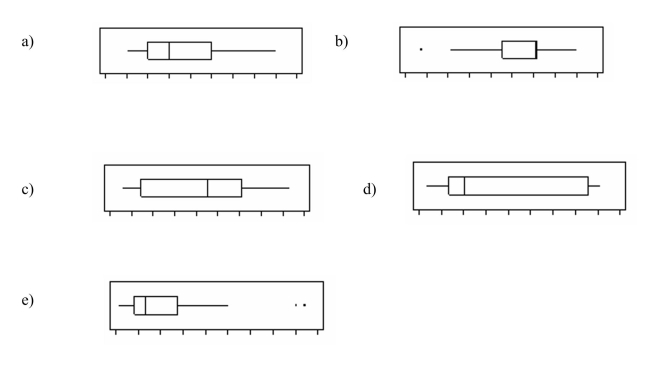
(Not Answered)
This question doesn't have any answer yet
Filters
- Essay(0)
- Multiple Choice(0)
- Short Answer(0)
- True False(0)
- Matching(0)