Exam 17: Statistics and Probability Questions
Exam 1: The Role of Statistics and the Data Analysis Process20 Questions
Exam 2: Collecting Data Sensibly28 Questions
Exam 3: Graphical Methods for Describing Data19 Questions
Exam 4: Numerical Methods for Describing Data21 Questions
Exam 5: Summarizing Bivariate Data17 Questions
Exam 6: Probability17 Questions
Exam 7: Random Variables and Probability Distributions20 Questions
Exam 8: Sampling Variability and Sampling Distributions16 Questions
Exam 9: Estimation Using a Single Sample20 Questions
Exam 10: Hypothesis Testing Using a Single Sample19 Questions
Exam 11: Comparing Two Populations or Treatments16 Questions
Exam 12: The Analysis of Categorical Data and Goodness-Of-Fit Tests9 Questions
Exam 13: Simple Linear Regression and Correlation: Inferential Methods22 Questions
Exam 14: Multiple Regression Analysis28 Questions
Exam 15: Analysis of Variance12 Questions
Exam 17: Statistics and Probability Questions152 Questions
Select questions type
Suppose that in a certain part of the world, in any 50-year period the probability of a plague is 0.39, the probability of a famine is 0.52, and the probability of both a plague and a famine is 0.15.What is the probability of a famine given that there is a plague?
(Multiple Choice)
4.9/5  (45)
(45)
Use the following information for questions 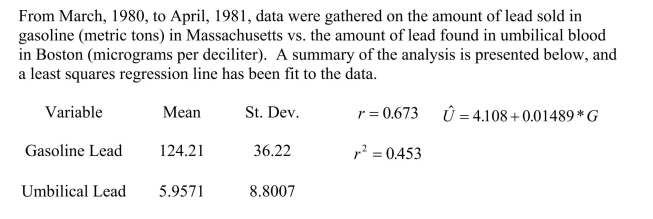 -Approximately what percentage of the variation in umbilical lead concentrations can be explained by the linear model?
(Multiple Choice)
4.8/5 (42)
Which of the following statements about normal curves is false?
(Multiple Choice)
4.9/5 (35)
The limitation imposed on population density by environmental factors is poorly understood.One theory is that terrestrial carnivores are particularly sensitive to the food supply.Spiders are very important species in terrestrial communities, and their survival is ecologically important.To better understand the relation between food level and spider survival, an experiment was conducted by supplementing the food supply of immature spiders in an area of low population density.In a control group of immature spiders, 83 out of 112 survived to the end of the experiment; in the food- supplemented experimental group, 76 out of 81 survived.The 90% confidence interval for the difference in population proportions is: 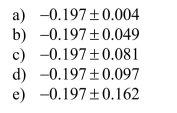
(Not Answered)
This question doesn't have any answer yet
Which of the following is the simple linear regression model? 
(Not Answered)
This question doesn't have any answer yet
Which of the following indicates that an association between x and y is positive?
(Multiple Choice)
5.0/5 (40)
A television game show has three payoffs with the following probabilities: 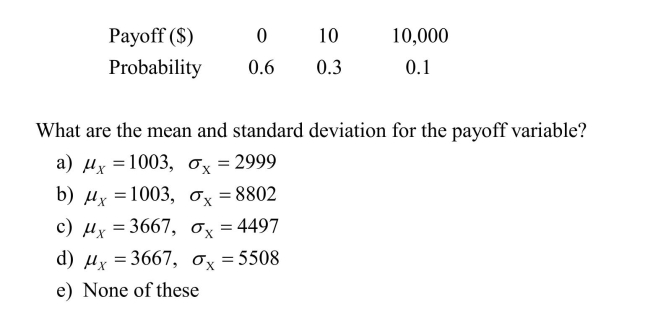
(Not Answered)
This question doesn't have any answer yet
Randomization, as a strategy in experimental design, would be unsuccessful if
(Multiple Choice)
4.8/5 (32)
For a large sample test of the difference of two proportions to be appropriate, these assumptions must be met: 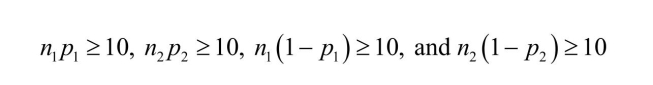 Of the following, what is the smallest total of the sample sizes that would meet these requirements?
(Multiple Choice)
4.7/5 (37)
According to Chebyshev's Rule, at least what percent of data is within 5 standard deviations of the mean?
(Multiple Choice)
4.8/5 (32)
A normal probability plot suggests that a normal probability model is plausible when:
(Multiple Choice)
4.8/5 (34)
The bias that occurs because observations were not made of all individuals selected for a sample is
(Multiple Choice)
4.8/5 (39)
Filters
- Essay(0)
- Multiple Choice(0)
- Short Answer(0)
- True False(0)
- Matching(0)