Exam 17: Statistics and Probability Questions
Exam 1: The Role of Statistics and the Data Analysis Process20 Questions
Exam 2: Collecting Data Sensibly28 Questions
Exam 3: Graphical Methods for Describing Data19 Questions
Exam 4: Numerical Methods for Describing Data21 Questions
Exam 5: Summarizing Bivariate Data17 Questions
Exam 6: Probability17 Questions
Exam 7: Random Variables and Probability Distributions20 Questions
Exam 8: Sampling Variability and Sampling Distributions16 Questions
Exam 9: Estimation Using a Single Sample20 Questions
Exam 10: Hypothesis Testing Using a Single Sample19 Questions
Exam 11: Comparing Two Populations or Treatments16 Questions
Exam 12: The Analysis of Categorical Data and Goodness-Of-Fit Tests9 Questions
Exam 13: Simple Linear Regression and Correlation: Inferential Methods22 Questions
Exam 14: Multiple Regression Analysis28 Questions
Exam 15: Analysis of Variance12 Questions
Exam 17: Statistics and Probability Questions152 Questions
Select questions type
A type II error is made by 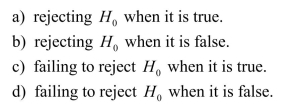
(Not Answered)
This question doesn't have any answer yet
Which of the calculated values of a test statistic would have the smallest P-value? 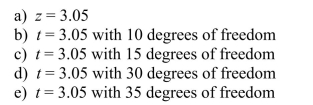
(Not Answered)
This question doesn't have any answer yet
Which of the following is not a property of a geometric experiment? 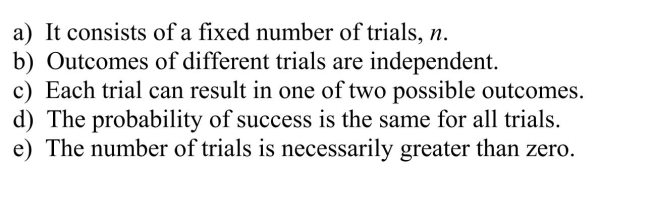
(Not Answered)
This question doesn't have any answer yet
In agricultural states the regulation of insecticide use can be a divisive issue.Suppose that 70 percent of the population in a particular agricultural state is in favor of such regulation and 30 percent against.If a random sample of 800 people from this agricultural state is interviewed, what is the approximate probability that more than 200 of the people sampled will be against regulation of insecticides? 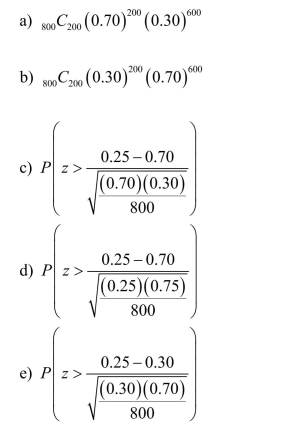
(Not Answered)
This question doesn't have any answer yet
A numerical variable whose value depends on the outcome of a chance experiment is called
(Multiple Choice)
4.8/5  (33)
(33)
By definition, a subset of a population selected for study is a
(Multiple Choice)
4.9/5 (39)
A good fit of the simple linear regression model would be characterized by 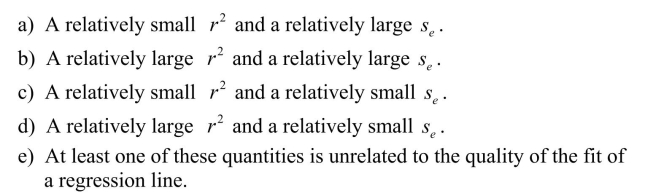 a regression line.
(Not Answered)
This question doesn't have any answer yet
In a randomized block design having k treatments and l blocks, the Tukey-Kramer interval for comparing the means of treatments 1 and 2 is 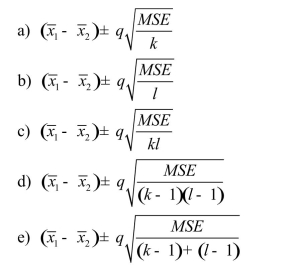
(Not Answered)
This question doesn't have any answer yet
In a carnival shell game, a contestant can win a prize by guessing which one of 5 identical walnut shells is covering a small marble.After each guess, the shells are randomly shuffled outside the view of the contestant.If a person plays the carnival game 4 times, what is the probability he or she wins a prize exactly 2 times? 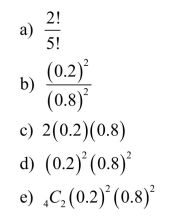
(Not Answered)
This question doesn't have any answer yet
A test statistic for testing the utility of a multiple regression model is 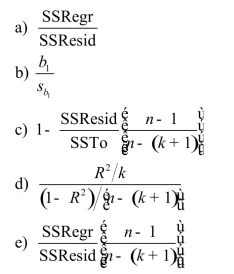
(Not Answered)
This question doesn't have any answer yet
Suppose that a frequency distribution and a cumulative frequency distribution are constructed from the same set of data, using the same classes.Then, for each class, 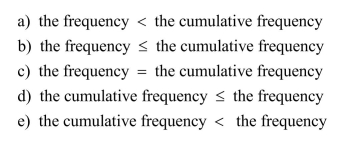
(Not Answered)
This question doesn't have any answer yet
In a study of male / female differences in carnivores, the height of the canine teeth in the
lower jaws were measured.The data below are graphic representations of these data.
Use these graphs to answer questions below. 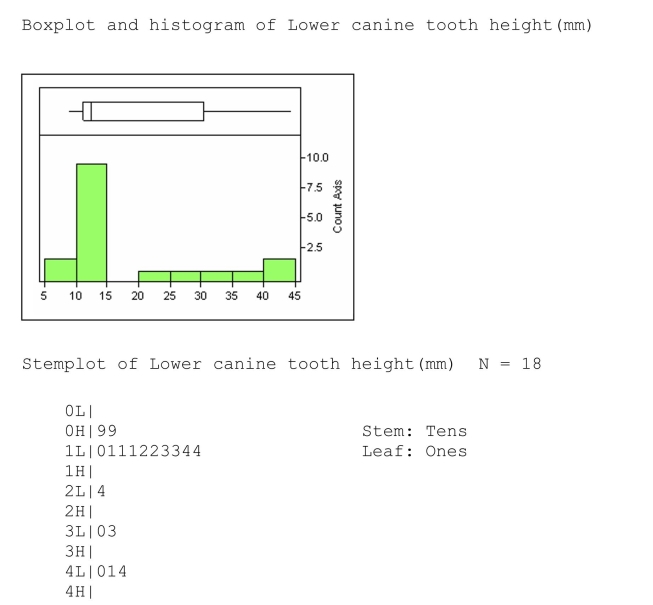 -Considering the graphic displays, the best description of these data would be:
(Multiple Choice)
4.8/5 (42)
Use the following frequency table to determine the proportion of values less than 60. 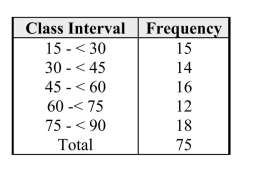
(Multiple Choice)
4.9/5 (36)
Filters
- Essay(0)
- Multiple Choice(0)
- Short Answer(0)
- True False(0)
- Matching(0)