Exam 13: Asking and Answering Questions About the Difference Between Two Means
Exam 1: Collecting Data in Reasonable Ways44 Questions
Exam 2: Graphical Methods for Describing Data Distributions33 Questions
Exam 3: Numerical Methods for Describing Data Distributions32 Questions
Exam 4: Describing Bivariate Numerical Data33 Questions
Exam 5: Probability45 Questions
Exam 6: Random Variables and Probability Distributions57 Questions
Exam 7: Selecting an Appropriate Method4 Questions
Exam 8: Sampling Variability Sampling25 Questions
Exam 9: Estimation Using a Single Sample29 Questions
Exam 10: Asking and Answering Questions About a Population Proportion37 Questions
Exam 11: Asking and Answering Questions About the Difference Between Two Population Proportions22 Questions
Exam 12: Asking and Answering Questions About a Population Mean38 Questions
Exam 13: Asking and Answering Questions About the Difference Between Two Means27 Questions
Exam 14: Learning From Experiment Data8 Questions
Select questions type
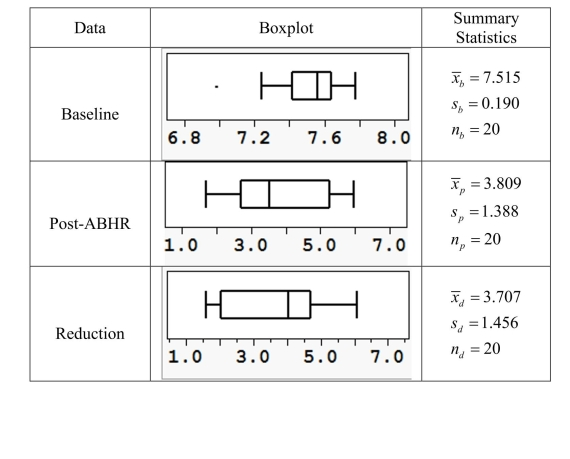
After an outbreak of a drug-resistant strain of bacteria (Enterococci faecium), hospital officials became concerned that their alcohol-based handrub (ABHR) hand hygiene program was not sufficient to prevent spreading this bacteria. The officials solicited 20 volunteers to assess the effectiveness of ABHR. The volunteers' hands were contaminated with E. faecium. After gathering baseline data on the amount of bacteria present they performed the recommended hand hygiene according to the World Health Organization protocol. The amount of bacteria present was then assessed again. Summary measures and boxplots of the baseline sample, the postABHR sample, and the reduction in the amount of bacteria bacteria are presented below. Do these data provide sufficient evidence that the ABHR is effective against the . faecium?
(Essay)
4.7/5  (38)
(38)
When analyzing paired data the population distribution of differences, not
the separate population distributions, should be credibly normal.
(True/False)
4.8/5 (34)
Inferences about the difference between two means fall into two categories: the
samples are independent, or the samples are paired.
a) What considerations would lead you to use the techniques for independent
samples rather than those for paired samples? You may use examples to
illustrate your ideas, but examples alone are not sufficient.
b) How do the analyses of independent samples and paired samples differ? In your
response, consider the hypotheses, methods, assumptions, and calculations.
(Essay)
4.8/5 (36)
The Amazon River basin includes the largest remaining connected area of tropical
forest in the world, and ecologists regularly monitor its health. One aspect of its
health is the density of different indigenous species. The Amazon basin includes both
areas that are periodically flooded, and areas that are not periodically flooded. If the
densities of species differ in the flooded and unflooded regions, researchers will want
to take stratified samples in their studies. Stratified sampling would be more
expensive, since boats must be rented to get to any randomly selected flooded sites.
The data below are measures of density (individuals per square kilometer) of primates
in random samples of flooded and unflooded areas in the Amazon basin. Primate density
Unflooded 123 137 106 77 103 79 195 227 182
Flooded 201 126 185 355 344 a) Do these data provide convincing evidence of a difference in the primate density
in flooded and unflooded forests in Amazonia? Provide appropriate statistical
justification for your conclusion.
b) Based on your results in part (a), would you recommend using a stratified sample?
Justify your recommendation with a statistical argument.
(Essay)
4.8/5 (39)
Male and female Downy Woodpeckers (Picoides pubescens) drill in different areas of trees. One theory about why this separation occurs is that there are physical characteristics of males and females that lead them to choose different foraging locations. One possibility is the bill length of the males and females; longer bills may let one gender or the other drill deeper into a tree.
The data in the table at right are the bill lengths of 12 male and 12 female randomly selected Downy Woodpeckers caught and released in a banding survey. The investigators would like to know whether these data provide evidence that the male and female Downy Woodpeckers differ in mean bill length. An initial analysis of the data established the plausibility that the distributions of bill lengths are approximately normal.
Downy Woodpecker Bill Lengths (cm)
Male Female 2.01 1.78 1.84 1.76 1.86 1.74 1.91 1.82 1.75 1.87 1.79 1.84 1.88 1.82 2.05 1.87 1.85 1.93 1.90 1.76 1.94 1.96 1.86 1.86
a) Construct a confidence interval for the difference in mean bill length for males and for females.
b) Do the data indicate that the mean bill length differs for males and females? Provide an appropriate statistical justification using your response in part (a).
(Essay)
4.9/5 (38)
Two samples are said to be independent when the selection of the
individuals in one sample has no bearing on the selection of those in the
other sample.
(True/False)
4.9/5 (39)
Filters
- Essay(0)
- Multiple Choice(0)
- Short Answer(0)
- True False(0)
- Matching(0)