Exam 2: Graphical Methods for Describing Data Distributions
Exam 1: Collecting Data in Reasonable Ways44 Questions
Exam 2: Graphical Methods for Describing Data Distributions33 Questions
Exam 3: Numerical Methods for Describing Data Distributions32 Questions
Exam 4: Describing Bivariate Numerical Data33 Questions
Exam 5: Probability45 Questions
Exam 6: Random Variables and Probability Distributions57 Questions
Exam 7: Selecting an Appropriate Method4 Questions
Exam 8: Sampling Variability Sampling25 Questions
Exam 9: Estimation Using a Single Sample29 Questions
Exam 10: Asking and Answering Questions About a Population Proportion37 Questions
Exam 11: Asking and Answering Questions About the Difference Between Two Population Proportions22 Questions
Exam 12: Asking and Answering Questions About a Population Mean38 Questions
Exam 13: Asking and Answering Questions About the Difference Between Two Means27 Questions
Exam 14: Learning From Experiment Data8 Questions
Select questions type
It is well known that the order of the questions in a survey can affect the responses.
This is thought to occur because issues raised in one question are remembered when
responding to later questions. In 1948 many people in the United States were
concerned about the spread of communism as a political and economic philosophy. A
survey given that year contained both of the following questions:
(i) Do you think the United States should let Communist newspaper reporters
from other countries come in here and send back to their papers the news as
they see it?
(ii) Do you think a Communist country like Russia should let American
newspaper reporters come in and send back to America the news as they see
it?
The following table contains the percentages of the Yes/No answers to question (i)
given by respondents when asked these questions in different orders. Responses to Communist reporter question in 1948 Question order \% Yes \% No Question (i) asked first 37 63 Question (ii) asked first 73 27 (a) Construct a comparative bar chart using these response percentages.
(b) Do you think the order of the questions made a difference in the responses?
Explain why or why not in a few sentences.
Free
(Essay)
4.9/5  (33)
(33)
Correct Answer: Verified
a) 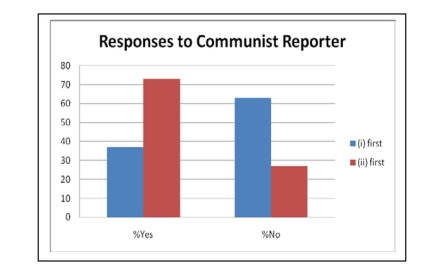
b) Yes, the order seems to have made a difference. The rate of "yes" responses
was very nearly doubled if the question was asked after the one about American
reporters in Russia.
A univariate data set must contain numerical, not categorical, data.
Free
(True/False)
4.8/5 (35)
Correct Answer:Verified
False
A numerical variable is continuous if it's possible values correspond to
isolated points on the number line.
Free
(True/False)
4.8/5 (35)
Correct Answer:Verified
False
Information about the Spanish missions of Baja California exist in the form of baptisms and burial records. These records provide an opportunity to study Native American populations under Spanish influence. The graph at right displays two time series of the numbers of baptisms at two Central Baja missions, San Jose de Comondu and San Gertrudis.
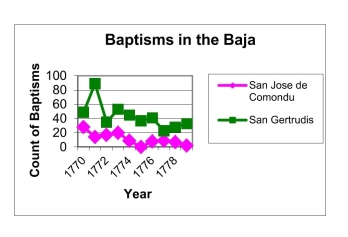 In a short paragraph describe and compare the trends in the number of baptisms for
the two missions in this time period, noting any interesting features apparent in the
plots.
In a short paragraph describe and compare the trends in the number of baptisms for
the two missions in this time period, noting any interesting features apparent in the
plots.
(Essay)
4.8/5 (30)
Knowledge of where animals forage for food is essential for effective wildlife
management and conservation. The data below are foraging heights (in m) for a
sample of Mountain Chickadees. The data are taken from two different species of fir
trees: the Douglas fir and the White fir. Douglas:
White: (a) Display these data using a comparative (back-to-back) stem-and-leaf plot. Use
the stems shown below, and be sure to include all information needed to compare
the two distributions. |OL |
| OH|
| 1L|
| 1H|
| 2L |
(b) Compare the distributions in part (a). What differences and similarities do you
observe in the two distributions?
(c) When Mountain Chicadees are sampled to assess their health, they are captured in
mist-nets, which are set to capture the birds at different heights. The mist nets are
about 2 meters high, and directions must be given to the persons who set up the
nests so that the mist-nets are positioned to capture the most birds. Based on the
data from part (a) and your display in part (b), write a short paragraph describing
the appropriate mist-net height in a forest region of Douglas firs and for a forest
region of White firs.
(Essay)
4.8/5 (35)
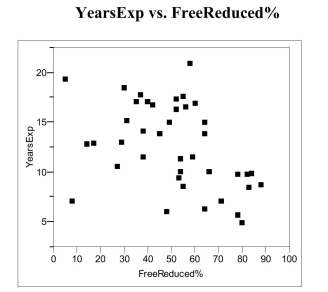
The Des Moines Register article in problem #2 also reported the percent of children eligible for Free and Reduced lunch to teacher experience. The percent of children eligible for Free/Reduced lunch is an indicator of the socio economic status of a neighborhood. The Register was concerned that less experienced teachers typically teach students from lower-income families. The accompanying scatter plot displays the data from the article.
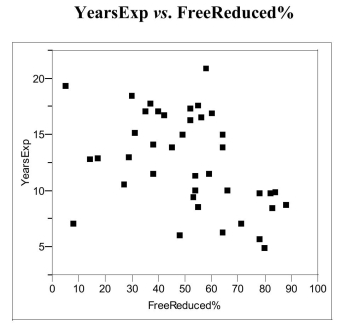 (a) If lesser experienced teachers typical ly teach students from low-income families,
what sort of trend or pattern should appear in the scatter plot?
(b) Does this trend or pattern emerge in these data? Explain, referring to specific
aspects of the scatterplot.
(a) If lesser experienced teachers typical ly teach students from low-income families,
what sort of trend or pattern should appear in the scatter plot?
(b) Does this trend or pattern emerge in these data? Explain, referring to specific
aspects of the scatterplot.
(Essay)
4.9/5 (47)
In a histogram, class intervals are required to be the same length.
(True/False)
4.7/5 (33)
During the first six months of the American Civil War, armies were amassed as never
before in history. Large groups of men, transported far from home, lived in
conditions that bred sickness. In a recent study involving Confederate muster rolls, a
researcher constructed a cumulative relative frequency distribution of the percentages
of Confederate soldiers reported sick for each company. A "Company" is a unit of
soldiers, usually between about 70 and 120 in size. The cumulative relative
frequency distribution for December, 1861, is shown below. 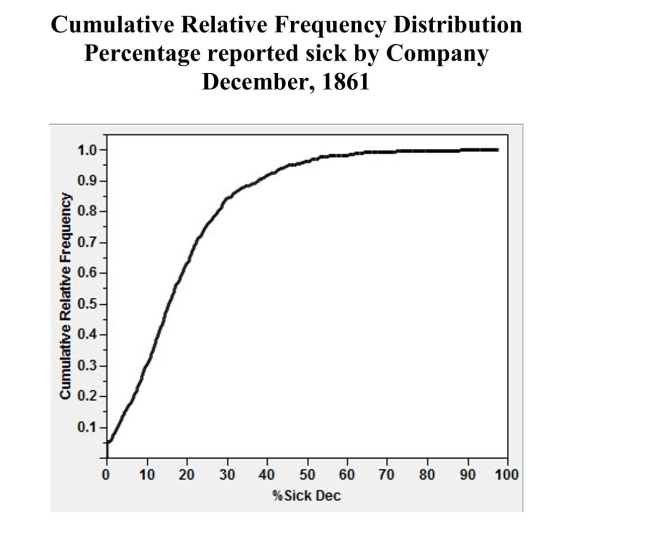 (a) Approximately what proportion of the Confederate companies had less than 10%
sick?
(b) Approximately wh at proportion of the Confederate companies had more than 30%
sick?
(c) Approximately 50% of the companies had less than what percentage of soldiers
sick?
(a) Approximately what proportion of the Confederate companies had less than 10%
sick?
(b) Approximately wh at proportion of the Confederate companies had more than 30%
sick?
(c) Approximately 50% of the companies had less than what percentage of soldiers
sick?
(Essay)
4.8/5 (34)
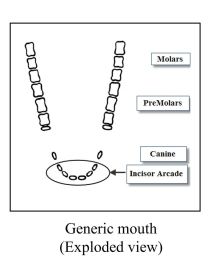
Hoofed animals such as cattle and sheep are classified as browsers (leaf eaters) and
grazers (grass eaters). Some biologists believe that the incisor arcade of the teeth,
diagrammed below, is shaped differently for browsers and grazers, affecting their
food selection. The "curvature" of an incisor arcade is a measure of its shape; large
values indicate a longer, thinner mouth and small values a shorter, wider mouth. The
back-to-back stem-and-leaf plot below compares the curvatures of incisor arcades for
different species of browsers and grazers. Curvature, Browsers vs. Grazers
Browser species Grazer species
N=18 N=54
|1| 9 |2| 1 |2| 889 413 || 22244 99885 |3H| 55566667778999999 410 |4L| 022223 99987 |4H| 55556666677778889 321 |5L| 03 |5| 9 |6| 0 |6| |7| 0 |7|
 (a) Briefly describe each distribution, noting any unusual features of the data.
(b) Some biologists believe browsers have thinner mouths because leafed plants
frequently have thorns and spines. They think that browsers have evolved thinner
mouths to get beyond the thorns and spines to the food part of the plant. Are the
data in the back-to-back stem-and-leaf plot consistent with this theory? Justify
your answer by appealing to specific aspect(s) of the plot.
(a) Briefly describe each distribution, noting any unusual features of the data.
(b) Some biologists believe browsers have thinner mouths because leafed plants
frequently have thorns and spines. They think that browsers have evolved thinner
mouths to get beyond the thorns and spines to the food part of the plant. Are the
data in the back-to-back stem-and-leaf plot consistent with this theory? Justify
your answer by appealing to specific aspect(s) of the plot.
(Essay)
4.7/5 (38)
Investigators were interested in communication about sex and related topics between
parents and 12-14 year olds. The investigators asked parents and students whether or
not they had communicated with their child/parent about topics such as pregnancy,
how to say "no," and methods of contraception. A scatter plot of their data is
presented below. Each point represents one topic listed by the investigators. For
example, 72.4% of parents and 57.6% of adolescents said the parents had discussed
childbirth. This would be recorded as the point (57.6, 72.4). 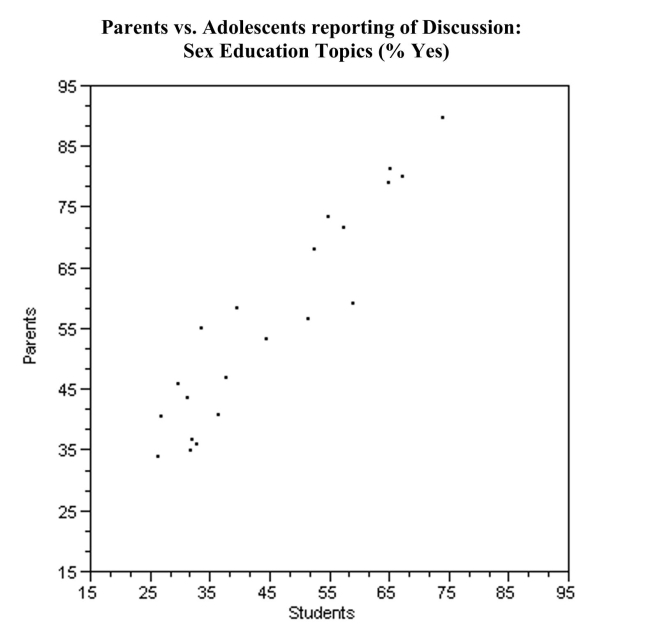 (a) On the graph above, sketch the line y x, representing a line of "perfect
agreement" between the parents and adolescents.
(b) What is a possible explanation of the placement of the points in the scatter plot
relative to the line you sketched in part (a)?
(a) On the graph above, sketch the line y x, representing a line of "perfect
agreement" between the parents and adolescents.
(b) What is a possible explanation of the placement of the points in the scatter plot
relative to the line you sketched in part (a)?
(Essay)
4.8/5 (27)
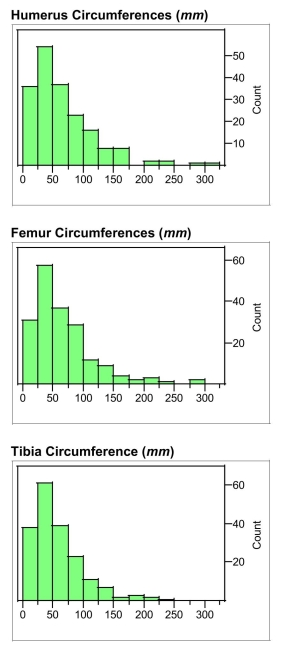
The average circumferences (distances around) in mm of the humerus, femur, and tibia
of different species of mammals are displayed below. These long bones primarily
support the body mass in mammals. Each data value is the mean circumference for
the available measures for a single species. (a)Describe the differences and similarities in the distributions of these different bones.
(b) Biologists speculate that greater weights might be supported by larger bones. Based on the histograms, if the biologists' speculations are correct, which of these bones (humerus, femur, or tibia) would seem to be the least able to support a large weight? Explain, referring to specific aspects of the histograms.
(Essay)
4.9/5 (39)
As part of the United States Census, data is collected on the number of persons in each
household. The census data for four decades are summarized below.
(a) In a few sentences describe how the (Percent distribution) proportion of households with 4 people has changed from 1970 to
Source: U.S. Census Bureau, Current Population Survey, March Supplements: 1970 to 2000 .
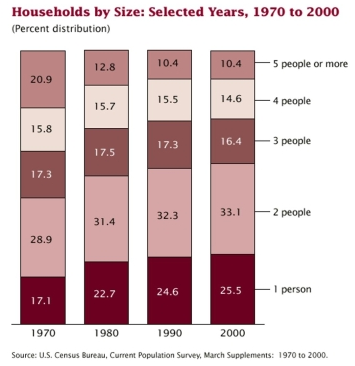 (b) What size of household appears to have decreased the most from 1970 to 2000?
(Essay)
4.8/5 (28)
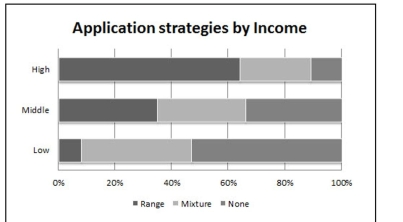
A study by the National Bureau of
Economic Research reports that college application strategies differ by income group. The three application strategies identified are: apply to a range of colleges, some selective some not; apply to no selective colleges; or, finally, use a mix of other strategies, such as applying to one selective college and one non-selective college. The percentages of students using these strategies, broken down by income, is shown in the table and the segmented bar chart.
In a few sentences describe how the college application strategies differ for the low, middle, and high income groups.
Range Mixture None Low 8 39 53 Middle 35 31 34 High 64 25 11
(Essay)
4.8/5 (26)
Artificial bird nests have been used extensively when studying predator behavior.
Biologists have assumed predators will find and respond to artificial and natural nests in the same way. In a study to test this assumption the predation of 27 American
Robin (Turdus migratorius) nests and 27 artificial wicker-basket nests were
compared. Artificial nests were placed 30m from existing robin's nests in a randomly
chosen direction. The natural nests and artificial nests were checked at 5-day
intervals, and the number of nests (out of 27) that had been disturbed by predators in
the interval was noted. The results are as follows: Numbers of real and artificial Robin nests predated Nest type 5-day check 10-day check 15-day check Natural 12 17 19 Artificial 3 12 18 (a) Using a single set of axes, construct time series plots for (a) the number of natural
nests disturbed by predators and (b) the number of artificial nests disturbed by
predators.
(b) Does it appear that the artificial and natural nests have the same pattern of
predation through time? Justify your answer by appealing to specific aspects of
your plot in part (a).
(Essay)
4.8/5 (26)
During the first six months of the American Civil War, armies were amassed as never
before in history. Large groups of men, transported far from home, lived in
conditions that bred sickness. In a recent study involving Confederate muster rolls, a
researcher constructed a cumulative relative frequency distribution of the percentages
of Confederate soldiers reported sick for each company. A "Company" is a unit of
soldiers, usually between about 70 and 120 in size. The cumulative relative
frequency distribution for October, 1861, is shown below.  (a) Approximately what proportion of the Confederate companies had less than 10%
sick?
(b) Approximately w hat proportion of the Confederate companies had more than 30%
sick?
(c) Approximately 50% of the companies had less than what percentage of soldiers
sick?
(a) Approximately what proportion of the Confederate companies had less than 10%
sick?
(b) Approximately w hat proportion of the Confederate companies had more than 30%
sick?
(c) Approximately 50% of the companies had less than what percentage of soldiers
sick?
(Essay)
4.9/5 (32)
The stem-and-leaf plot below displays the weights (in ounces) for a random sample of
tomatoes grown on a local farm
2L|4 2H| 3L|2 Weights of Tomatoes (oz) 2\mid4 2\mid 3\mid2 3\mid89 stem: ones 4\mid13 leaf : tenths 4\mid5589 5\mid11122334 5\mid668999 6\mid223344 6\mid5556 4H|5589 5L|11122334 5H|668999 6L|223344 6H|5556
(a) Briefly describe the distribution of tomato weights.
(b) What is the weight of the heaviest tomato in the sample?
(Essay)
4.9/5 (29)
It is well known that the order of the questions in a survey can affect the responses.
This is thought to occur because issues raised in one question are remembered when
responding to later questions. In 1974 a survey asked the following questions about
doctors and lawyers:
1. Would you say that most doctors in this country are really interested in the
public good, or are most doctors just out to make a lot of money?
2. Would you say that most lawyers in this country are really interested in the
public good, or are most lawyers just out to make a lot of money?
The following table summarizes the responses to the lawyer question when these
questions were asked in different orders. Responses to lawyer question Question order \% Public good \% Making money Lawyer question asked first 26 74 Doctor question asked first 30 70 (a) Construct a comparative bar chart for these response percentages.
(b) Do you think the order of the questions made a difference in the responses?
Explain.
(Essay)
5.0/5 (31)
The Des Moines Register article in problem also related the percent of children eligible for Free and Reduced lunch to teacher experience. The percent of children eligible for Free/Reduced lunch is an indicator of the socio economic status of a neighborhood. The Register was concerned that less experienced teachers typically teach students from low income families. The accompanying scatter plot displays the data from the article.
 (a) If lesser experienced teachers typical ly teach students from low-income families,
what sort of trend or pattern should appear in the scatter plot?
(b) Does this trend or pattern emerge in these data? Explain, referring to specific
aspects of the scatterplot.
(a) If lesser experienced teachers typical ly teach students from low-income families,
what sort of trend or pattern should appear in the scatter plot?
(b) Does this trend or pattern emerge in these data? Explain, referring to specific
aspects of the scatterplot.
(Essay)
4.9/5 (38)
Filters
- Essay(0)
- Multiple Choice(0)
- Short Answer(0)
- True False(0)
- Matching(0)