Exam 12: Asking and Answering Questions About a Population Mean
Exam 1: Collecting Data in Reasonable Ways44 Questions
Exam 2: Graphical Methods for Describing Data Distributions33 Questions
Exam 3: Numerical Methods for Describing Data Distributions32 Questions
Exam 4: Describing Bivariate Numerical Data33 Questions
Exam 5: Probability45 Questions
Exam 6: Random Variables and Probability Distributions57 Questions
Exam 7: Selecting an Appropriate Method4 Questions
Exam 8: Sampling Variability Sampling25 Questions
Exam 9: Estimation Using a Single Sample29 Questions
Exam 10: Asking and Answering Questions About a Population Proportion37 Questions
Exam 11: Asking and Answering Questions About the Difference Between Two Population Proportions22 Questions
Exam 12: Asking and Answering Questions About a Population Mean38 Questions
Exam 13: Asking and Answering Questions About the Difference Between Two Means27 Questions
Exam 14: Learning From Experiment Data8 Questions
Select questions type
All other things being equal, choosing a smaller value of α will increase
the probability of making a type II error.
Free
(True/False)
4.8/5  (35)
(35)
Correct Answer: Verified
True
The State Fisheries Department wishes to stock the Styx River with fish, and would like the
species to not only survive but thrive. The "substrate" (pebble size at bottom) of a river is an
important determinant of the quality of spawning habitat. Unknown to the Fisheries
officials, the pebble diameters in the Styx River are approximately normally distributed with
a mean of 24 mm, and a standard deviation of 8 mm. Fisheries officials will select a random
sample of pebbles in an attempt to estimate the average pebble size. a) On the scale below, sketch two curves, one representing the distribution of the original population and the other the sampling distribution of for a sample of size . Be sure to indicate which curve is which. What are the mean and standard deviation of the sampling distribution of ?  b) What is the approximate probability that a sample of n = 16 from this population would
result in a sample mean greater than 30 mm?
The graph below is a relative frequency histogram of the lengths of the gentle Hecate fish in the
Styx River, as recorded during a large fish tagging survey. You can assume that this histogram
represents the population of fish lengths.
b) What is the approximate probability that a sample of n = 16 from this population would
result in a sample mean greater than 30 mm?
The graph below is a relative frequency histogram of the lengths of the gentle Hecate fish in the
Styx River, as recorded during a large fish tagging survey. You can assume that this histogram
represents the population of fish lengths. 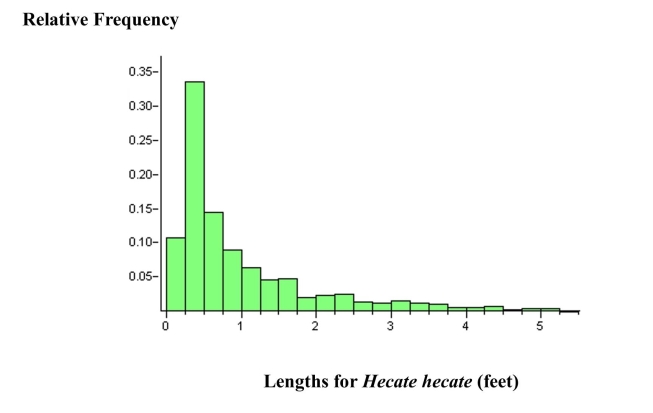 c) Suppose you were to take a random sample, n = 4, from this population of fish and
measure their lengths. Describe the shape, center, and spread of the sampling
distribution of x , as compared to the population distribution.
c) Suppose you were to take a random sample, n = 4, from this population of fish and
measure their lengths. Describe the shape, center, and spread of the sampling
distribution of x , as compared to the population distribution.
Free
(Essay)
4.8/5 (40)
Correct Answer:Verified
a)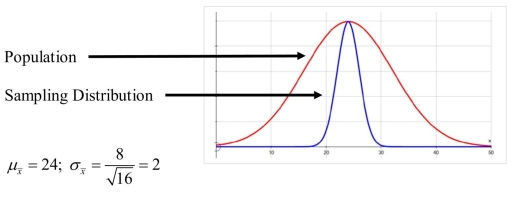
b)
c)
Shape: Closer to normal (less skewed)
than is the population distribution.
Local health authorities are concerned that the hectic pace in their city has elevated
the stress, and thus the blood pressure, of women. The authorities will study this
issue by measuring the blood pressure of a random sample of women in the city and
estimating the mean blood pressure, μ , of women in the city. Blood pressure is
approximately normally distributed in humans, and a previous study suggests the
population standard deviation of women's blood pressure is about 8 mm Hg.
Suppose the health authorities accept this value as a reasonable estimate of the
standard deviation of blood pressure of today's women in this city. If it is desired to
estimate μ to within 1.0 mm Hg with 95% confidence, what is the minimum sample
size that is necessary?
(Essay)
4.9/5 (43)
Describe in a few sentences how each of the following affects the power of a test: a) The size of the difference between the actual value and the hypothesized value of the population mean.
b) The significance level,
c) The sample size
(Essay)
4.8/5 (33)
Logging activity in forests is thought to affect the behavior of black bears (Ursus americanus). An important measure of animal behavior is the home range, the area used by animals in their lives. In a study of black bears in a logged Canadian forest, the spring and early summer home range (in ) of 12 radio-collared female black bears was measured with the following results:
a) Construct and interpret a confidence interval for the mean home range of female black bears in this logged forest.
b) The typical home range of females in forests with no logging is . Based on the confidence interval from part (a), do you think that the mean home range size of females in this logged forest could be the same as the mean home range size in non-logged forests? Explain, using appropriate statistical terminology.
(Essay)
4.8/5 (32)
One indicator of the health of field mice is the length of their tails. The following
data on tail length (in mm) were gathered from a representative sample of field mice
near Fairfield, Iowa. A biologist would like to construct a 95% confidence interval
for the population mean tail length of the field mice near Fairfield. Tail lengths of field mice () 56.1 59.1 59.2 59.3 59.5 59.7 59.7 59.8 60.0 60.1 60.2 60.3 60.3 60.3 60.4 60.4 60.5 60.5 60.6 60.6 60.7 60.8 60.9 61.4 a) Using a graphical display of your choice, display the data in a way that will allow
you to determine whether it would be appropriate to use a t confidence interval to
estimate the population mean.
b) Using the graphical display from part (a), would you advise that constructing a t
confidence interval is appropriate? Explain the basis of your recommendation.
(Essay)
4.8/5 (34)
Describe in a few sentences how each of the following affects the power of a test: a) The size of the difference between the actual value and the hypothesized value of the population mean.
b) The significance level,
c) The sample size
(Essay)
4.7/5 (32)
A A random sample of size is selected from a population with mean and standard deviation . Determine the mean and standard deviation of the sampling distribution of .
(Essay)
5.0/5 (34)
Give as much information as you can about the P-value of a t-test in the following
situations: a) Two-tailed test,
b) Lower-tailed test,
(Essay)
4.8/5 (36)
The level of significance of a test is the probability of making a type I
error.
(True/False)
4.8/5 (37)
Give as much information as you can about the P-value of a t-test in the following
situations: a) Two-tailed test,
b) Upper-tailed test,
(Essay)
4.8/5 (33)
When the hatching of young geese is very near, the father guards the nest to defend it from predators that may be attracted by the hatchlings noisy entrance into the world. The following data are the typical distances from the nest for 24 soon to be father geese. A biologist would like to construct a confidence interval for the mean distance of future father geese from the nest during this period. (Distances are in .)
2.0 4.4 4.5 4.5 4.7 4.9 4.9 5.0 5.2 5.3 5.3 5.4 5.4 5.4 5.5 5.5 5.6 5.6 5.6 5.6 5.7 5.8 5.9 6.3
a) Using a graphical display of your choice, display the data in a way that will allow you to determine whether it would be appropriate to use a confidence interval to estimate the population mean.
b) Using the graphical display from part (a), would you advise that constructing a confidence interval is appropriate? Explain the basis of your recommendation.
(Essay)
4.8/5 (40)
A very large study of college students' study habits found that the time (in hours) that
freshmen study each week is approximately normal with mean 24 hours and standard
deviation 8 hours. Consider random samples of size 16 from the population of freshmen. a) On the axes below, sketch curves representing the distribution of the original population and the sampling distribution of for samples of size . Be sure to indicate which curve is which. What are the mean and standard deviation of the sampling distribution of ?
 b) What is the probability that a sample of size from this population would result in a sample mean greater than 30 hours? The study of college freshmen also asked about the students' time spent playing video games. Suppose that the population relative frequency histogram for time spend playing video games is as shown below. The mean amount of time spent playing video games was hours per week.
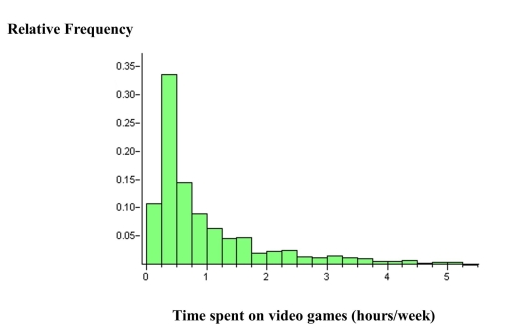 c) Suppose you were to take a random sample, , from this population of freshmen and ask them how much time they spent playing video games per week. Describe the shape, center, and spread of the sampling distribution of , as compared to the population distribution.
(Essay)
4.8/5 (32)
Many national parks, wildlife refuges, and wilderness areas lie directly below designated
military air space. This raises issues of whether wildlife and loud jet noises are compatible.
In an effort to evaluate the effects of low-altitude jet-noise, researchers simulated these
noises for a representative sample of captive desert mule deer. Three minutes after the loud
noises were played, the heart rates (beats per minute) of these animals was measured, with
the following results: a) Calculate and interpret a 95% confidence interval for the mean heart rate 3 minutes after
loud jet noises.
b) The usual mean heart rate for desert mule deer is about 51.2 beats per minute. Does the
confidence interval in part (a) support the view that the loud jet noise has some lingering
effect on the heart rate of desert mule deer? Explain, using appropriate statistical
language.
(Essay)
4.8/5 (32)
When performing hypothesis tests, there are assumptions that must be met in order for the test
to be appropriate. Describe the assumptions associated with a hypothesis test about a
population mean when the sample size is small. For any assumptions that can be checked
using sample data, describe how the check would be performed.
(Essay)
4.7/5 (32)
Filters
- Essay(0)
- Multiple Choice(0)
- Short Answer(0)
- True False(0)
- Matching(0)