Exam 18: Extending the Analysis of Aggregate Supply
Exam 2: The Market System and the Circular Flow274 Questions
Exam 3: Demand, Supply, and Market Equilibrium357 Questions
Exam 4: Market Failures Caused by Externalities Asymmetric Information222 Questions
Exam 5: Public Goods, Public Choice, and Government Failure242 Questions
Exam 6: An Introduction to Macroeconomics243 Questions
Exam 7: Measuring Domestic Output and National Income238 Questions
Exam 8: Economic Growth274 Questions
Exam 9: Business Cycles, Unemployment, and Inflation298 Questions
Exam 10: Basic Macroeconomic Relationships233 Questions
Exam 11: The Aggregate Expenditures Model126 Questions
Exam 12: Aggregate Demand and Aggregate Supply320 Questions
Exam 13: Fiscal Policy, Deficits, and Debt401 Questions
Exam 14: Money, Banking, and Financial Institutions265 Questions
Exam 15: Money Creation285 Questions
Exam 16: Interest Rates and Monetary Policy405 Questions
Exam 17: Financial Economics356 Questions
Exam 18: Extending the Analysis of Aggregate Supply268 Questions
Exam 19: Current Issues in Macro Theory and Policy279 Questions
Exam 20: International Trade339 Questions
Exam 21: The Balance of Payments, Exchange Rates, and Trade Deficits315 Questions
Exam 22: The Economics of Developing Countries269 Questions
Select questions type
How do supply-side economists see reducing taxes as a way to improve productivity?
(Essay)
4.9/5  (29)
(29)
Based on the long-run Phillips Curve, any rate of inflation is compatible in the long run with the
natural rate of unemployment.
(True/False)
4.9/5 (38)
 Refer to the graph. Assume the economy is at the initial position of . An increase in aggregate
Demand with a corresponding adjustment in in?ation expectations and wages will tend to
Refer to the graph. Assume the economy is at the initial position of . An increase in aggregate
Demand with a corresponding adjustment in in?ation expectations and wages will tend to
(Multiple Choice)
4.7/5 (42)
 Refer to the graph. Assume that the economy is initially at equilibrium at point C and that the government has adopted a hands-off policy approach. If demand-pull inflation occurs, then the final
Long-run equilibrium point will be point __; while if cost-push inflation occurs (starting at point C), then the final long-run equilibrium point will be point __.
Refer to the graph. Assume that the economy is initially at equilibrium at point C and that the government has adopted a hands-off policy approach. If demand-pull inflation occurs, then the final
Long-run equilibrium point will be point __; while if cost-push inflation occurs (starting at point C), then the final long-run equilibrium point will be point __.
(Multiple Choice)
4.8/5 (37)
 Refer to the graph. If the economy is in initial equilibrium at AD , then, from a strict supply-
Side perspective, a cut in taxes or tax rates would produce an equilibrium price and quantity of
Refer to the graph. If the economy is in initial equilibrium at AD , then, from a strict supply-
Side perspective, a cut in taxes or tax rates would produce an equilibrium price and quantity of
(Multiple Choice)
4.8/5 (41)
Average Tax Rate Tax Revenue (\ B) 20\% \ 250 40 300 60 250 80 200 Refer to the table. If the current tax rate is 60 percent, supply-side economists would advocate
(Multiple Choice)
4.8/5 (44)
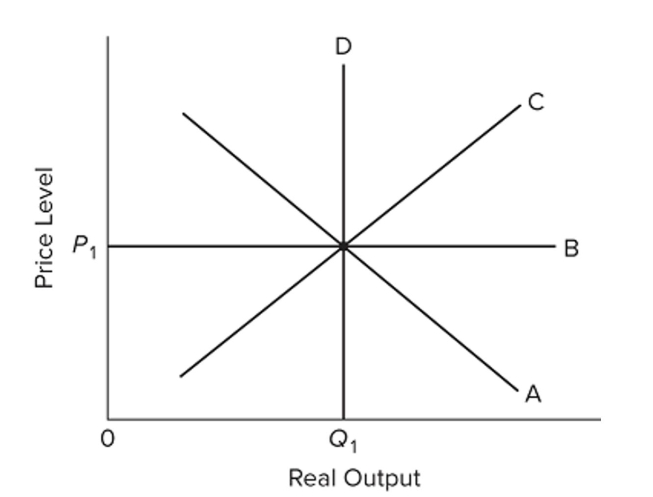 Refer to the diagram and assume that prices and wages are flexible both upward and downward in the economy. In the extended AD-AS model,
(Multiple Choice)
4.8/5 (33)
In the long run, if the price level decreases, then the economy's output level will
(Multiple Choice)
4.7/5 (34)
Demand-pull inflation and cost-push inflation have similar effects on real output in the short run.
(True/False)
4.8/5 (38)
In the last half of the 1990s, the usual short-run trade-off between inflation and unemployment did not arise because
(Multiple Choice)
4.9/5 (28)
The Laffer Curve suggests that within a certain range, lower tax rates will increase tax revenues.
(True/False)
4.7/5 (44)
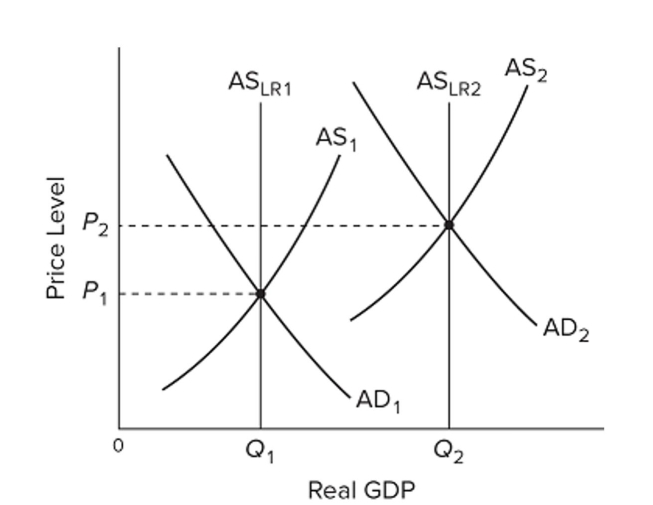 Refer to the graphs, where the subscripts on the labels denote years 1 and 2. In year 1 the economy
(Multiple Choice)
4.8/5 (35)
According to the simple extended AD-AS model, aggregate demand is a major determinant of the
level of output in the long run.
(True/False)
4.8/5 (33)
If prices and wages are flexible, a decrease in aggregate demand will in the long run cause only a(n)
(Multiple Choice)
4.8/5 (39)
 Refer to the diagram and assume the economy is initially at point represents
(Multiple Choice)
4.7/5 (38)
The short-run aggregate supply curve illustrates the idea that if the price level falls, firms will experience
(Multiple Choice)
4.9/5 (42)
Adverse aggregate-supply shocks or stagflation would cause a
(Multiple Choice)
4.8/5 (38)
Filters
- Essay(0)
- Multiple Choice(0)
- Short Answer(0)
- True False(0)
- Matching(0)