Exam 18: Extending the Analysis of Aggregate Supply
Exam 2: The Market System and the Circular Flow274 Questions
Exam 3: Demand, Supply, and Market Equilibrium357 Questions
Exam 4: Market Failures Caused by Externalities Asymmetric Information222 Questions
Exam 5: Public Goods, Public Choice, and Government Failure242 Questions
Exam 6: An Introduction to Macroeconomics243 Questions
Exam 7: Measuring Domestic Output and National Income238 Questions
Exam 8: Economic Growth274 Questions
Exam 9: Business Cycles, Unemployment, and Inflation298 Questions
Exam 10: Basic Macroeconomic Relationships233 Questions
Exam 11: The Aggregate Expenditures Model126 Questions
Exam 12: Aggregate Demand and Aggregate Supply320 Questions
Exam 13: Fiscal Policy, Deficits, and Debt401 Questions
Exam 14: Money, Banking, and Financial Institutions265 Questions
Exam 15: Money Creation285 Questions
Exam 16: Interest Rates and Monetary Policy405 Questions
Exam 17: Financial Economics356 Questions
Exam 18: Extending the Analysis of Aggregate Supply268 Questions
Exam 19: Current Issues in Macro Theory and Policy279 Questions
Exam 20: International Trade339 Questions
Exam 21: The Balance of Payments, Exchange Rates, and Trade Deficits315 Questions
Exam 22: The Economics of Developing Countries269 Questions
Select questions type
The experience of the United States with supply-side policies is that tax cuts affect the economy
more on the demand side rather than the supply side.
(True/False)
4.8/5  (39)
(39)
Average Tax Rate Tax Revenue (\ B) 20\% \ 250 40 300 60 250 80 200 If graphed, the relationship shown would depict this economy's
(Multiple Choice)
4.9/5 (36)
In the period 2011 through 2018, as the economy slowly mended, the economy experienced an ongoing pattern of falling inflation coinciding with falling unemployment. This suggests a
(Multiple Choice)
4.9/5 (37)
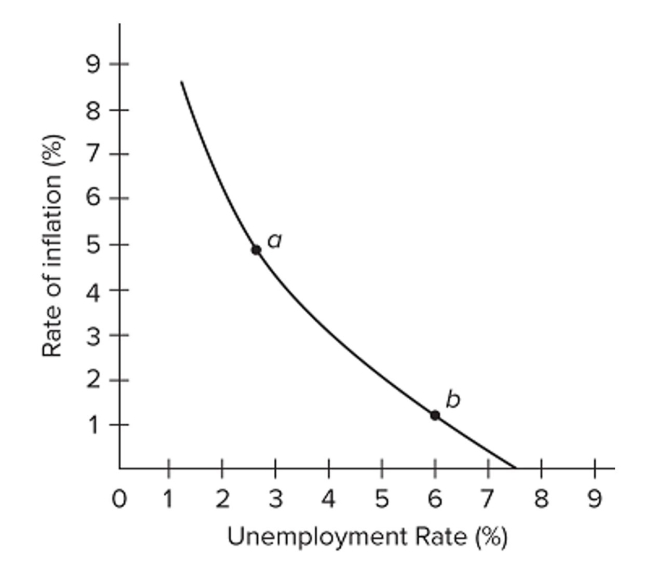 Refer to the diagram for a specific economy. Which of the following best describes a decision by policymakers that moves this economy from point b to point a?
(Multiple Choice)
4.9/5 (40)
If the government adopts a hands-off policy toward inflation, then the long run effects of cost-push
inflation and demand-pull inflation are identical.
(True/False)
4.9/5 (37)
Disinflation can be explained by the Phillips Curve analysis as resulting from a situation where the actual rate of inflation is initially less than the expected rate, causing the unemployment rate to
(Multiple Choice)
4.9/5 (43)
The Romer and Romer paper, "The Macroeconomic Effects of Tax Changes: Estimates Based on a New Measure of Fiscal Shocks," found that tax changes that are made to promote long-run growth
Or to reduce an inherited budget deficit tend to result in
(Multiple Choice)
4.8/5 (37)
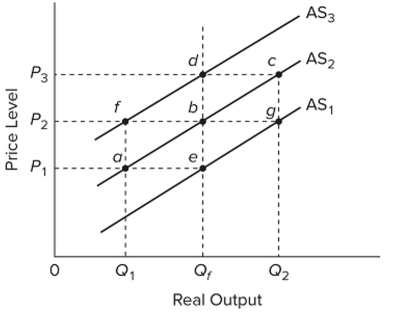 Refer to the diagram. Assume that nominal wages initially are set based on the price level P2 and that the economy initially is operating at its full-employment level of output Qf. In the long run, demand-pull inflation could best be shown as
(Multiple Choice)
4.7/5 (42)
 Refer to the graphs. Assume that the economy is initially at equilibrium where AD and AS intersect
In Graph 1, and also assume that the economy is initially at point C in Graph 2. A movement from
Point C to point B in graph 2 would most likely be associated, in graph 1, with a shift of
Refer to the graphs. Assume that the economy is initially at equilibrium where AD and AS intersect
In Graph 1, and also assume that the economy is initially at point C in Graph 2. A movement from
Point C to point B in graph 2 would most likely be associated, in graph 1, with a shift of
(Multiple Choice)
4.8/5 (32)
 Refer to the graph. Assume that the economy is initially at full-employment equilibrium at point A. If AD increases, then the long-run equilibrium point will be at point
(Multiple Choice)
4.9/5 (41)
Consider the following national data: tax revenues as a percentage of GDP: 25 percent; government spending as a percentage of GDP: 31 percent; unemployment rate: 9 percent; inflation rate: 6
Percent. What is the misery index for this nation?
(Multiple Choice)
4.9/5 (38)
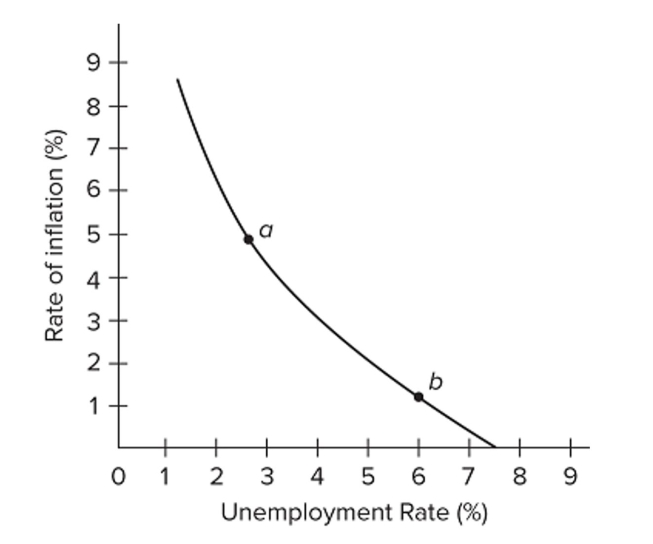 Refer to the diagram for a specific economy. The curve on this graph is known as a
(Multiple Choice)
4.8/5 (41)
Filters
- Essay(0)
- Multiple Choice(0)
- Short Answer(0)
- True False(0)
- Matching(0)