Exam 18: Extending the Analysis of Aggregate Supply
Exam 2: The Market System and the Circular Flow274 Questions
Exam 3: Demand, Supply, and Market Equilibrium357 Questions
Exam 4: Market Failures Caused by Externalities Asymmetric Information222 Questions
Exam 5: Public Goods, Public Choice, and Government Failure242 Questions
Exam 6: An Introduction to Macroeconomics243 Questions
Exam 7: Measuring Domestic Output and National Income238 Questions
Exam 8: Economic Growth274 Questions
Exam 9: Business Cycles, Unemployment, and Inflation298 Questions
Exam 10: Basic Macroeconomic Relationships233 Questions
Exam 11: The Aggregate Expenditures Model126 Questions
Exam 12: Aggregate Demand and Aggregate Supply320 Questions
Exam 13: Fiscal Policy, Deficits, and Debt401 Questions
Exam 14: Money, Banking, and Financial Institutions265 Questions
Exam 15: Money Creation285 Questions
Exam 16: Interest Rates and Monetary Policy405 Questions
Exam 17: Financial Economics356 Questions
Exam 18: Extending the Analysis of Aggregate Supply268 Questions
Exam 19: Current Issues in Macro Theory and Policy279 Questions
Exam 20: International Trade339 Questions
Exam 21: The Balance of Payments, Exchange Rates, and Trade Deficits315 Questions
Exam 22: The Economics of Developing Countries269 Questions
Select questions type
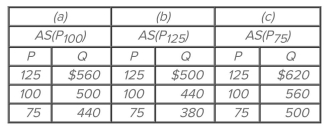 Suppose the full employment level of real output (Q) for a hypothetical economy is $500, the price level (P) initially is 100, and prices and wages are flexible both upward and downward. Refer to the
Accompanying short-run aggregate supply schedules. If the price level unexpectedly declines from
100 to 75, the level of real output in the short run will
Suppose the full employment level of real output (Q) for a hypothetical economy is $500, the price level (P) initially is 100, and prices and wages are flexible both upward and downward. Refer to the
Accompanying short-run aggregate supply schedules. If the price level unexpectedly declines from
100 to 75, the level of real output in the short run will
(Multiple Choice)
4.8/5  (42)
(42)
Given a Phillips Curve with stable and predictable inflation and unemployment rate trade-offs, it appears that
(Multiple Choice)
4.9/5 (32)
The implication of the long-run Phillips Curve is that there is no trade-off between inflation and
unemployment in the long-run.
(True/False)
4.8/5 (37)
 Refer to the diagram. The general agreement of most economists is that the U.S. economy today is
(Multiple Choice)
4.7/5 (35)
Differentiate between "demand-pull" and "cost-push" inflation in the extended aggregate demand
and aggregate supply model.
(Essay)
4.8/5 (30)
The short-run Phillips Curve intersects the long-run Phillips Curve at the
(Multiple Choice)
4.9/5 (39)
(Last Word) The Romer and Romer paper, "The Macroeconomic Effects of Tax Changes: Estimates Based on a New Measure of Fiscal Shocks," identified the major motivations for most significant
Legislated tax changes to be the following, except
(Multiple Choice)
4.9/5 (38)
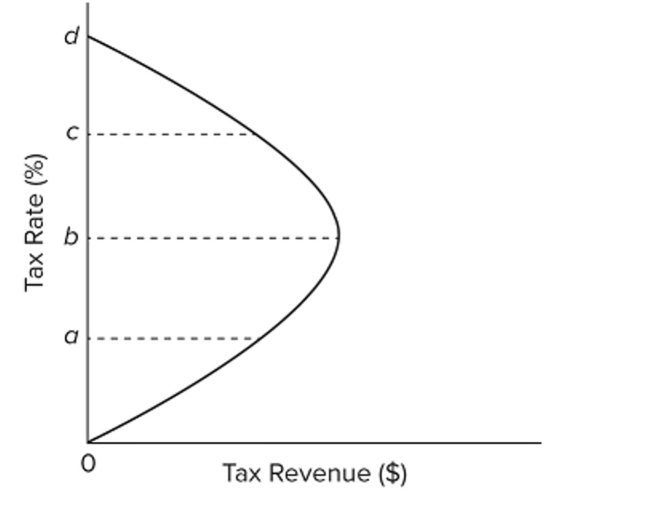
One central idea in supply-side economics concerning budget deficits is illustrated by the
(Multiple Choice)
4.7/5 (34)
 In the accompanying graphs, Q refers to the economy's potential output level. Graph A is
Constructed on the basic assumption that
In the accompanying graphs, Q refers to the economy's potential output level. Graph A is
Constructed on the basic assumption that
(Multiple Choice)
4.9/5 (29)
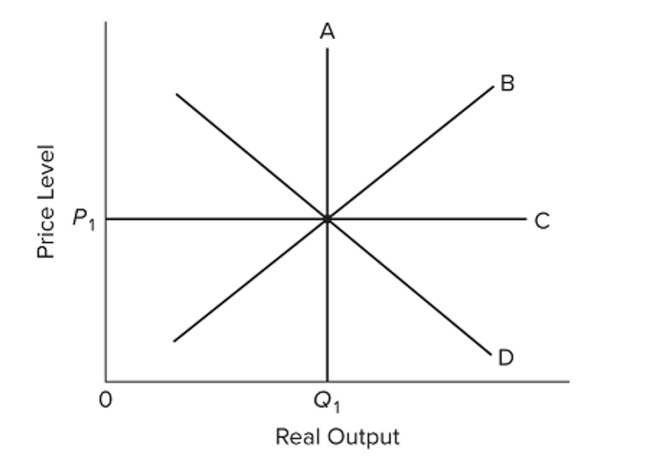 Refer to the diagram. If the price level rises above because of an increase in aggregate demand,
The
Refer to the diagram. If the price level rises above because of an increase in aggregate demand,
The
(Multiple Choice)
4.8/5 (30)
If the expected rate of inflation rises, then the short-run Phillips Curve will
(Multiple Choice)
4.7/5 (35)
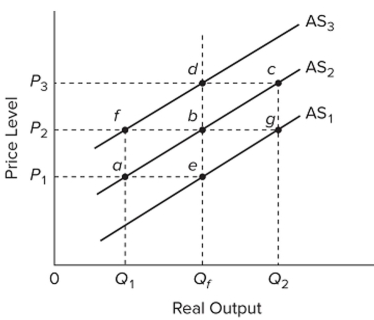 Refer to the diagram. Assume that nominal wages initially are set based on the price level P2 and that the economy initially is operating at its full-employment level of output Qf. In terms of this diagram, the long-run aggregate supply curve
(Multiple Choice)
4.8/5 (41)
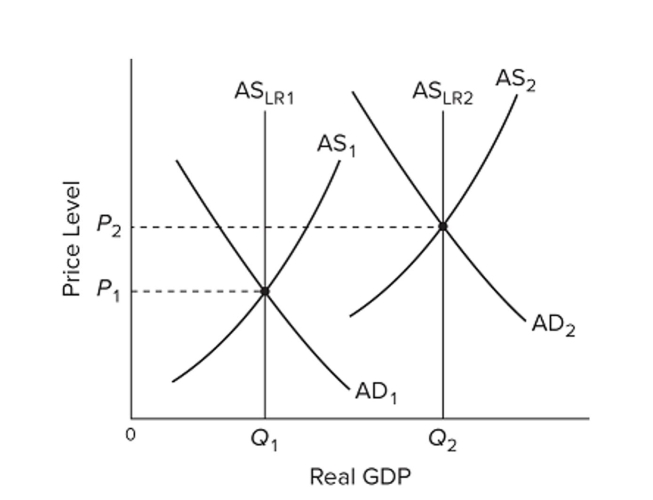 Refer to the graphs, where the subscripts on the labels denote years 1 and 2. From the graphs we can conclude that from year 1 to year 2,
(Multiple Choice)
4.9/5 (37)
The level of potential output and location of the long-run aggregate supply curve are determined by
(Multiple Choice)
4.9/5 (31)
 Refer to the diagram. Assume that the natural rate of unemployment is 5 percent and that the economy is initially operating at point a, where the expected and actual rates of inflation are each 6
Percent. If the actual rate of inflation unexpectedly falls from 6 percent to 4 percent, then the
Unemployment rate will
Refer to the diagram. Assume that the natural rate of unemployment is 5 percent and that the economy is initially operating at point a, where the expected and actual rates of inflation are each 6
Percent. If the actual rate of inflation unexpectedly falls from 6 percent to 4 percent, then the
Unemployment rate will
(Multiple Choice)
4.9/5 (38)
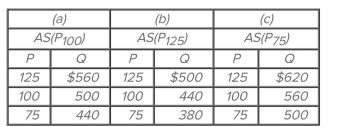 Suppose the full employment level of real output (Q) for a hypothetical economy is $500, the price level (P) initially is 100, and prices and wages are flexible both upward and downward. Refer to the
Accompanying short-run aggregate supply schedules. In the long run, an increase in the price level
From 100 to 125 will
Suppose the full employment level of real output (Q) for a hypothetical economy is $500, the price level (P) initially is 100, and prices and wages are flexible both upward and downward. Refer to the
Accompanying short-run aggregate supply schedules. In the long run, an increase in the price level
From 100 to 125 will
(Multiple Choice)
4.7/5 (39)
 Refer to the diagram. If the tax rate is currently c and the government wants to maximize tax revenue, it should
(Multiple Choice)
4.7/5 (25)
Which action will tend to decrease aggregate supply, according to supply-side economists?
(Multiple Choice)
4.7/5 (35)
Filters
- Essay(0)
- Multiple Choice(0)
- Short Answer(0)
- True False(0)
- Matching(0)