Exam 18: Extending the Analysis of Aggregate Supply
Exam 2: The Market System and the Circular Flow274 Questions
Exam 3: Demand, Supply, and Market Equilibrium357 Questions
Exam 4: Market Failures Caused by Externalities Asymmetric Information222 Questions
Exam 5: Public Goods, Public Choice, and Government Failure242 Questions
Exam 6: An Introduction to Macroeconomics243 Questions
Exam 7: Measuring Domestic Output and National Income238 Questions
Exam 8: Economic Growth274 Questions
Exam 9: Business Cycles, Unemployment, and Inflation298 Questions
Exam 10: Basic Macroeconomic Relationships233 Questions
Exam 11: The Aggregate Expenditures Model126 Questions
Exam 12: Aggregate Demand and Aggregate Supply320 Questions
Exam 13: Fiscal Policy, Deficits, and Debt401 Questions
Exam 14: Money, Banking, and Financial Institutions265 Questions
Exam 15: Money Creation285 Questions
Exam 16: Interest Rates and Monetary Policy405 Questions
Exam 17: Financial Economics356 Questions
Exam 18: Extending the Analysis of Aggregate Supply268 Questions
Exam 19: Current Issues in Macro Theory and Policy279 Questions
Exam 20: International Trade339 Questions
Exam 21: The Balance of Payments, Exchange Rates, and Trade Deficits315 Questions
Exam 22: The Economics of Developing Countries269 Questions
Select questions type
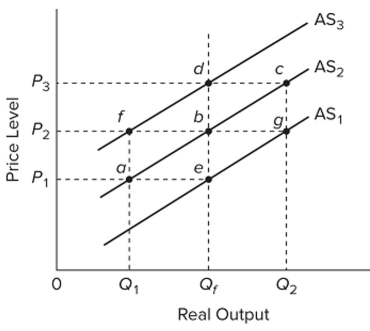 Refer to the diagram. Assume that nominal wages initially are set based on the price level P2 and that the economy initially is operating at its full-employment level of output Qf. In the short run, demand-pull inflation could best be shown as
(Multiple Choice)
4.9/5  (42)
(42)
 Refer to the diagram and assume the economy is initially at point . Which of the following
Movements is consistent with the traditional Phillips Curve?
Refer to the diagram and assume the economy is initially at point . Which of the following
Movements is consistent with the traditional Phillips Curve?
(Multiple Choice)
4.9/5 (43)
If government uses fiscal policy to restrain cost-push inflation, we can expect
(Multiple Choice)
4.7/5 (36)
 Refer to the diagram. The natural rate of unemployment for this economy is
(Multiple Choice)
4.9/5 (36)
The traditional Phillips Curve suggests a trade-off between
(Multiple Choice)
4.9/5 (40)
 Refer to the Laffer Curve. A cut in the tax rate from T would
(Multiple Choice)
4.9/5 (43)
 Refer to the graphs, where the subscripts on the labels denote years 1 and 2. From the graphs we can clearly conclude that the economy
(Multiple Choice)
4.8/5 (40)
In an aggregate demand-aggregate supply framework, fiscal policy that emphasizes cutting taxes as a means of improving incentives to work, save, and invest would be characterized primarily as a
(Multiple Choice)
4.8/5 (35)
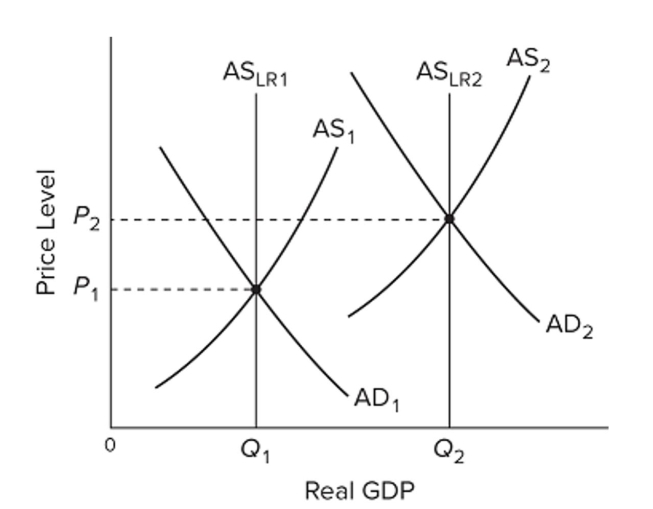
 Refer to the graph. Economic growth driven by productivity and technology would be illustrated as a shift of
(Multiple Choice)
4.8/5 (39)
Government can push the unemployment rate below the natural rate only by
(Multiple Choice)
4.9/5 (31)
A stable Phillips curve does not allow for the possibility of stagflation.
(True/False)
4.8/5 (46)
 Refer to the graph. Critics of supply-side economics would argue that tax rates are currently between
(Multiple Choice)
4.8/5 (39)
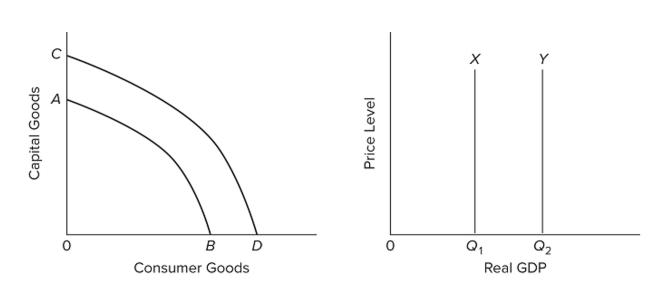 Refer to the graphs. Growth of production capacity is shown by
(Multiple Choice)
4.8/5 (43)
Filters
- Essay(0)
- Multiple Choice(0)
- Short Answer(0)
- True False(0)
- Matching(0)