Exam 18: Extending the Analysis of Aggregate Supply
Exam 2: The Market System and the Circular Flow274 Questions
Exam 3: Demand, Supply, and Market Equilibrium357 Questions
Exam 4: Market Failures Caused by Externalities Asymmetric Information222 Questions
Exam 5: Public Goods, Public Choice, and Government Failure242 Questions
Exam 6: An Introduction to Macroeconomics243 Questions
Exam 7: Measuring Domestic Output and National Income238 Questions
Exam 8: Economic Growth274 Questions
Exam 9: Business Cycles, Unemployment, and Inflation298 Questions
Exam 10: Basic Macroeconomic Relationships233 Questions
Exam 11: The Aggregate Expenditures Model126 Questions
Exam 12: Aggregate Demand and Aggregate Supply320 Questions
Exam 13: Fiscal Policy, Deficits, and Debt401 Questions
Exam 14: Money, Banking, and Financial Institutions265 Questions
Exam 15: Money Creation285 Questions
Exam 16: Interest Rates and Monetary Policy405 Questions
Exam 17: Financial Economics356 Questions
Exam 18: Extending the Analysis of Aggregate Supply268 Questions
Exam 19: Current Issues in Macro Theory and Policy279 Questions
Exam 20: International Trade339 Questions
Exam 21: The Balance of Payments, Exchange Rates, and Trade Deficits315 Questions
Exam 22: The Economics of Developing Countries269 Questions
Select questions type
The automatic adjustment mechanism that makes the economy move toward the long-run Phillips Curve is
(Multiple Choice)
4.8/5  (36)
(36)
 The graph describes the notion that as tax rates rise from zero percent, tax revenues will
(Multiple Choice)
4.9/5 (44)
Rightward and upward shifts of the Phillips Curve in the 1970s and early 1980s were caused by
(Multiple Choice)
4.9/5 (41)
 Refer to the graph. If tax rates are between b and d, then supply-side economists are of the opinion that a(n)
(Multiple Choice)
4.9/5 (40)
In the long run, if the price level increases, then nominal wages and other input prices will
(Multiple Choice)
4.9/5 (34)
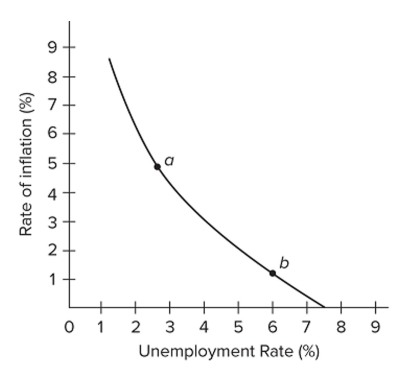
 Refer to the diagram. Point b would not be permanent because the
(Multiple Choice)
4.9/5 (38)
 Refer to the graph. Suppose that the economy is at an initial equilibrium where the AD curves intersect. Demand-pull in?ation in the long run can best be illustrated as a shift of
(Multiple Choice)
4.9/5 (40)
In terms of aggregate supply, a period in which nominal wages and other resource prices are unresponsive to price-level changes is called the
(Multiple Choice)
4.8/5 (38)
According to the simple extended AD-AS model, if the economy is in a recession, prices and
nominal wages will eventually fall and the short-run aggregate supply curve will increase, so that
real output returns to its full-employment level in the long run.
(True/False)
4.9/5 (36)
According to the simple extended AD-AS model, cost-push inflation does not last in the long run if
the government leaves the economy alone.
(True/False)
4.7/5 (38)
 Refer to the graph. Assume the economy is at the initial position of . It is possible for the
Government to reduce the unemployment rate and move the economy to C2 if
Refer to the graph. Assume the economy is at the initial position of . It is possible for the
Government to reduce the unemployment rate and move the economy to C2 if
(Multiple Choice)
4.9/5 (33)
According to the simple extended AD-AS model, demand-pull inflation and cost-push inflation have
the same effect on output in the long run.
(True/False)
4.9/5 (50)
Demand-pull inflation and cost-push inflation are identical concepts because both involve lower
unemployment rates and rising prices.
(True/False)
4.8/5 (37)
 Refer to the diagram for a specific economy. An increase in aggregate demand will
(Multiple Choice)
5.0/5 (32)
The short-run aggregate supply curve is vertical, and the long-run aggregate supply curve is
horizontal.
(True/False)
4.8/5 (29)
Filters
- Essay(0)
- Multiple Choice(0)
- Short Answer(0)
- True False(0)
- Matching(0)