Exam 10: Basic Macroeconomic Relationships
Exam 2: The Market System and the Circular Flow274 Questions
Exam 3: Demand, Supply, and Market Equilibrium357 Questions
Exam 4: Market Failures Caused by Externalities Asymmetric Information222 Questions
Exam 5: Public Goods, Public Choice, and Government Failure242 Questions
Exam 6: An Introduction to Macroeconomics243 Questions
Exam 7: Measuring Domestic Output and National Income238 Questions
Exam 8: Economic Growth274 Questions
Exam 9: Business Cycles, Unemployment, and Inflation298 Questions
Exam 10: Basic Macroeconomic Relationships233 Questions
Exam 11: The Aggregate Expenditures Model126 Questions
Exam 12: Aggregate Demand and Aggregate Supply320 Questions
Exam 13: Fiscal Policy, Deficits, and Debt401 Questions
Exam 14: Money, Banking, and Financial Institutions265 Questions
Exam 15: Money Creation285 Questions
Exam 16: Interest Rates and Monetary Policy405 Questions
Exam 17: Financial Economics356 Questions
Exam 18: Extending the Analysis of Aggregate Supply268 Questions
Exam 19: Current Issues in Macro Theory and Policy279 Questions
Exam 20: International Trade339 Questions
Exam 21: The Balance of Payments, Exchange Rates, and Trade Deficits315 Questions
Exam 22: The Economics of Developing Countries269 Questions
Select questions type
If there is a decrease in disposable income in an economy, then
Free
(Multiple Choice)
4.8/5  (37)
(37)
Correct Answer: Verified
B
In contrast to investment, consumption is
Free
(Multiple Choice)
4.7/5 (32)
Correct Answer:Verified
B
The investment demand curve will shift to the right as the result of
(Multiple Choice)
4.9/5 (39)
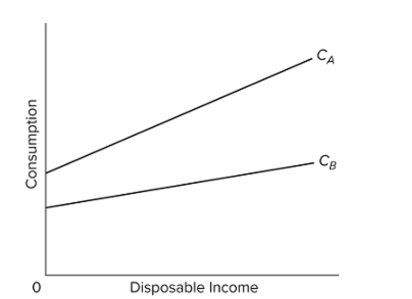 Refer to the given diagram, which shows consumption schedules for economies A and B. We can say that the
(Multiple Choice)
5.0/5 (38)
(Advanced analysis) Assume the following consumption schedule: C = 20 + 0.9Y, where C is consumption and Y is disposable income. The MPC is
(Multiple Choice)
4.7/5 (45)
Disposable Income Saving \ 0 -\ 10 50 0 100 10 150 20 200 30 Refer to the given data for a hypothetical economy. At the $100 level of income, the average propensity to save is
(Multiple Choice)
4.8/5 (37)
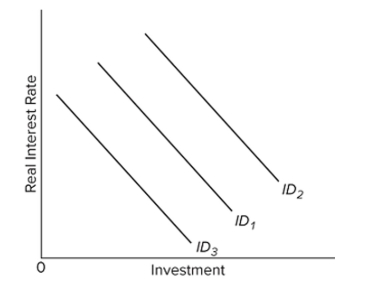 Refer to the diagram. Which of the following would shift the investment demand curve from ID1 to ID3?
(Multiple Choice)
4.7/5 (30)
If DI is $275 billion and the APC is 0.8, we can conclude that saving is $55 billion.
(True/False)
4.9/5 (40)
In an economy, for every $10 million increase in disposable income, saving increases by $2 million. It can be concluded that the
(Multiple Choice)
4.9/5 (43)
The slope of the consumption schedule between two points on the schedule is
(Multiple Choice)
4.9/5 (42)
If business taxes are reduced and the real interest rate increases,
(Multiple Choice)
4.8/5 (37)
If Matt's disposable income increases from $4,000 to $4,500 and his level of saving increases from $200 to $325, it may be concluded that his marginal propensity to
(Multiple Choice)
4.8/5 (44)
If the consumption schedule shifts upward and the shift was not caused by a tax change, the saving schedule
(Multiple Choice)
4.8/5 (46)
If disposable income decreases from $1,800 to $1,500 and MPC = 0.75, then saving will
(Multiple Choice)
4.8/5 (30)
Given the consumption schedule, it is possible to graph the relevant saving schedule by
(Multiple Choice)
4.9/5 (31)
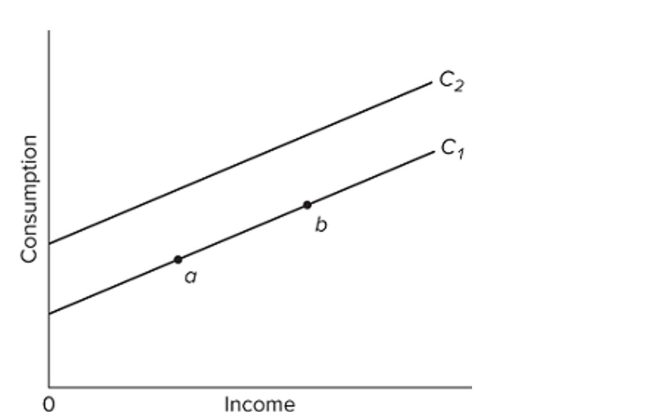 Refer to the given graph. A shift of the consumption schedule from C1 to C2 might be caused by a(n)
(Multiple Choice)
4.9/5 (35)
Filters
- Essay(0)
- Multiple Choice(0)
- Short Answer(0)
- True False(0)
- Matching(0)