Exam 3: Polynomial and Rational Functions
Exam 1: Equations and Graphs112 Questions
Exam 2: Functions113 Questions
Exam 3: Polynomial and Rational Functions128 Questions
Exam 4: Exponential and Logarithmic Functions112 Questions
Exam 5: Trigonometric Functions: Right Triangle Approach116 Questions
Exam 6: Trigonometric Functions: Unit Circle Approach120 Questions
Exam 7: Conic Sections129 Questions
Exam 8: Polar Coordinates and Parametric Equations116 Questions
Exam 9: Vectors in Two and Three Dimensions115 Questions
Exam 10: Systems of Equations and Inequalities97 Questions
Exam 11: Matrices and Determinants117 Questions
Exam 12: Conic Sections104 Questions
Exam 13: Sequences and Series106 Questions
Exam 14: Counting and Probability95 Questions
Select questions type
A function f is given, and the indicated transformations are applied to its graph (in the given order). Write the equation for the final transformed graph. ; shift to the left unit, shrink vertically by a factor of 0.2, and shift downward 2 units.
(Short Answer)
4.9/5  (32)
(32)
Determine if the equation
defines as a function of . Explain your answer.
(Essay)
4.9/5 (42)
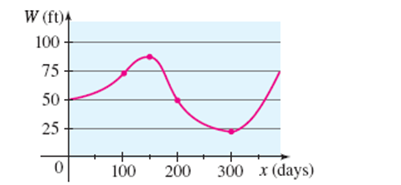
The graph shows the depth of water W in a reservoir over a one-year period as a function of the number of days x since the beginning of the year. Estimate the average rate of change of W between x = 0 and x= 100?
(Multiple Choice)
4.8/5 (41)
A function f is given, and the indicated transformations are applied to its graph (in the given order). Write the equation for the final transformed graph.
; shift to the left
unit, shrink vertically by a factor of 0.2, and shift downward 2 units.
(Essay)
4.8/5 (40)
Use a graphing device to draw the graph of the function
State approximately the intervals on which the function is increasing and on which the function is decreasing.
(Essay)
4.8/5 (26)
Determine whether the curve represents a graph of a function. 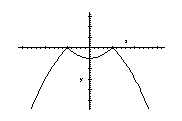
(Multiple Choice)
4.9/5 (34)
Use a graphing device to draw the graph of the function
. State approximately the intervals on which the function is increasing and on which the function is decreasing.
(Essay)
5.0/5 (42)
The graph shows the depth of water W in a reservoir over a one-year period as a function of the number of days x since the beginning of the year. What was the average rate of change of W between x = 0 and x= 100?

(Short Answer)
4.7/5 (23)
Use a graphing calculator or computer to determine whether or not the function is one-to-one.
(Essay)
4.9/5 (30)
Filters
- Essay(0)
- Multiple Choice(0)
- Short Answer(0)
- True False(0)
- Matching(0)