Exam 3: Polynomial and Rational Functions
Exam 1: Equations and Graphs112 Questions
Exam 2: Functions113 Questions
Exam 3: Polynomial and Rational Functions128 Questions
Exam 4: Exponential and Logarithmic Functions112 Questions
Exam 5: Trigonometric Functions: Right Triangle Approach116 Questions
Exam 6: Trigonometric Functions: Unit Circle Approach120 Questions
Exam 7: Conic Sections129 Questions
Exam 8: Polar Coordinates and Parametric Equations116 Questions
Exam 9: Vectors in Two and Three Dimensions115 Questions
Exam 10: Systems of Equations and Inequalities97 Questions
Exam 11: Matrices and Determinants117 Questions
Exam 12: Conic Sections104 Questions
Exam 13: Sequences and Series106 Questions
Exam 14: Counting and Probability95 Questions
Select questions type
A function is given. Use a graphing calculator to draw the graph of
f. Find the domain and range of f from the graph.
(Essay)
4.8/5  (35)
(35)
Use a graphing calculator to determine approximately the intervals on which the function is increasing, and on which is decreasing.
(Essay)
4.9/5 (45)
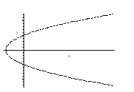
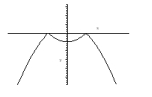
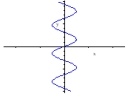
Determine whether each curve represents a graph of a function.
a.)
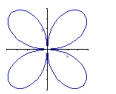 b.)
b.)
 c.)
c.)
 d.)
d.)
(Short Answer)
4.8/5 (31)
A function f is given, and the indicated transformations are applied to its graph (in the given order). Find the equation for the final transformed graph. ; shift 5 units to the left, stretch vertically by a factor of 2, and reflect in the x-axis
(Multiple Choice)
4.7/5 (39)
Determine if the equation defines as a function of . Explain your answer.
(Essay)
4.9/5 (41)
For the function
determine the average rate of change between the values and .
(Short Answer)
4.8/5 (34)
The graph gives the number of farms in the United States from 1850 to 2000.Estimate the average rate of change in the number of farms between the following years.
(i) 1860 and 1890
(ii) 1920 and 1980 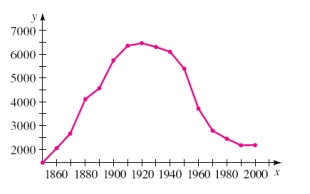
(Essay)
4.8/5 (45)
Use a graphing dervice to draw the graph of the function . State approximately the interval ) on which the function is increasing and on which the function is decreasing.
(Multiple Choice)
4.9/5 (32)
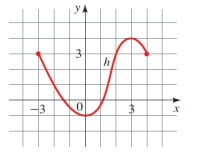
The graph of a function is given.
(a) Find , and
(b) Find the domain and range of .
(c) Find the values of for which
(d) Find the values of for which .
(Essay)
5.0/5 (36)
Determine which viewing rectangle produces the most appropriate graph of the function.
(Multiple Choice)
4.8/5 (34)
For the function
determine the average rate of change between the values
and
(Essay)
4.8/5 (37)
Filters
- Essay(0)
- Multiple Choice(0)
- Short Answer(0)
- True False(0)
- Matching(0)