Exam 4: Graphical Descriptive Techniques Numerical Data
Exam 1: What Is Statistics17 Questions
Exam 2: Types of Data, Data Collection and Sampling18 Questions
Exam 3: Graphical Descriptive Techniques Nominal Data17 Questions
Exam 4: Graphical Descriptive Techniques Numerical Data65 Questions
Exam 5: Numerical Descriptive Measures149 Questions
Exam 6: Probability113 Questions
Exam 7: Random Variables and Discrete Probability Distributions50 Questions
Exam 8: Continuous Probability Distributions113 Questions
Exam 9: Statistical Inference and Sampling Distributions69 Questions
Exam 10: Estimation: Describing a Single Population125 Questions
Exam 11: Estimation: Comparing Two Populations36 Questions
Exam 12: Hypothesis Testing: Describing a Single Population124 Questions
Exam 13: Hypothesis Testing: Comparing Two Populations69 Questions
Exam 14: Additional Tests for Nominal Data: Chi-Squared Tests113 Questions
Exam 15: Simple Linear Regression and Correlation213 Questions
Exam 16: Multiple Regression122 Questions
Exam 17: Time-Series Analysis and Forecasting147 Questions
Exam 18: Index Numbers27 Questions
Select questions type
The number of faulty items returned to a manufacturer of electric goods in the last 15 years is as follows: Year No. of faulty items 2001 27 2002 35 2003 34 2004 39 2005 43 2006 42 2007 40 2008 41 2009 45 2010 47 2011 46 2012 50 2013 49 2014 52 2015 52 a. Construct a frequency bar chart for these data.
b. Construct a line chart.
(Essay)
4.9/5  (40)
(40)
Describe the linear relationship between the two numerical variables in each of the following scatter diagrams. A.
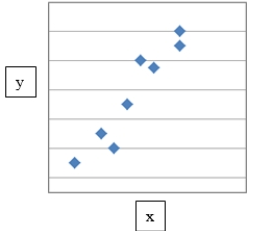 B.
B.
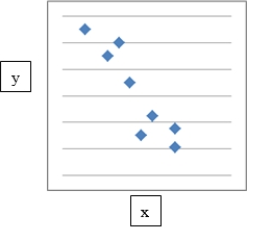 C.
C.
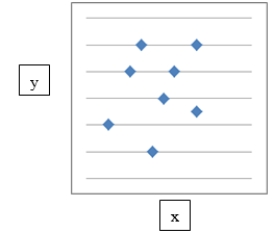
(Essay)
4.8/5 (38)
Frequency polygons are useful for obtaining a general idea of the shape of the distribution, because they are a bar chart.
(True/False)
4.8/5 (45)
Describe briefly what the histogram and the stem-and-leaf displays tell you about the test grades for a university business statistics class. 63 74 42 65 51 54 36 56 68 57 62 64 76 67 79 61 81 77 59 38 84 68 71 94 71 86 69 75 91 55 48 82 83 54 79 62 68 58 41 47
(Essay)
4.8/5 (35)
Which of the following statements about histograms is true?
(Multiple Choice)
4.9/5 (30)
Filters
- Essay(0)
- Multiple Choice(0)
- Short Answer(0)
- True False(0)
- Matching(0)