Exam 21: An Introduction to Macroeconomics
Exam 1: What Is Economics261 Questions
Exam 2: The Economy: Myth and Reality185 Questions
Exam 3: The Fundamental Economic Problem: Scarcity and Choice290 Questions
Exam 4: Supply and Demand: an Initial Look337 Questions
Exam 21: An Introduction to Macroeconomics216 Questions
Exam 22: The Goals of Macroeconomic Policy212 Questions
Exam 23: Economic Growth: Theory and Policy228 Questions
Exam 24: Aggregate Demand and the Powerful Consumer219 Questions
Exam 25: Demand-Side Equilibrium: Unemployment or Inflation216 Questions
Exam 26: Bringing in the Supply Side: Unemployment and Inflation228 Questions
Exam 27: Managing Aggregate Demand: Fiscal Policy210 Questions
Exam 28: Money and the Banking System224 Questions
Exam 29: Monetary Policy: Conventional and Unconventional210 Questions
Exam 30: The Financial Crisis and the Great Recession66 Questions
Exam 31: The Debate Over Monetary and Fiscal Policy219 Questions
Exam 32: Budget Deficits in the Short and Long Run215 Questions
Exam 33: The Trade-Off Between Inflation and Unemployment219 Questions
Exam 34: International Trade and Comparative Advantage226 Questions
Exam 35: The International Monetary System: Order or Disorder218 Questions
Exam 36: Exchange Rates and the Macroeconomy219 Questions
Exam 37: Contemporary Issues in the Us Economy23 Questions
Select questions type
How does the calculation of GDP include the costs of natural resource depletion that occurs when output is produced?
(Multiple Choice)
4.9/5  (40)
(40)
The aggregate demand curve shows the quantity of domestic product
(Multiple Choice)
4.8/5 (42)
The primary benefit to the macroeconomy of increasing government spending is a(n)
(Multiple Choice)
4.9/5 (47)
The end of the housing boom of the early 2000s can be illustrated by a decline in aggregate demand.
(True/False)
5.0/5 (36)
Poor Asian countries may have per capita GDPs that may be less than $250. Why is this somewhat misleading for comparative purposes?
(Multiple Choice)
4.9/5 (43)
Aggregate demand and supply curves have been widely used to analyze the performance of the macroeconomy. Figure 5-3 shows four diagrams that represent different changes in the macroeconomy. Choose the diagram that best represents the situations described in the following questions. Figure 5-3
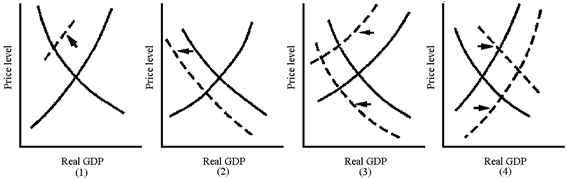 Which graph in Figure 5-3 best represents the favorable macroeconomy of the late 1990s?
(Multiple Choice)
4.9/5 (36)
Figure 5-2
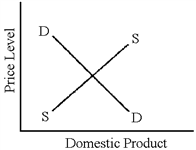 In Figure 5-2, if the aggregate demand curve shifts outward over time, the economy will
(Multiple Choice)
4.8/5 (30)
Stagflation is the simultaneous occurrence of inflation and high unemployment.
(True/False)
4.8/5 (37)
The term "stagflation" was invented in the 1970s to describe an economy experiencing both
(Multiple Choice)
4.7/5 (32)
During the Great Depression of the 1930s, unemployment peaked at _____ percent.
(Multiple Choice)
4.9/5 (33)
The supply-side policies of the Reagan and Bush administrations led to high levels of
(Multiple Choice)
4.8/5 (31)
If the government uses stabilization policies to reduce inflation, the economy may have to suffer
(Multiple Choice)
4.9/5 (39)
Since the end of World War II, the economy of the United States has been more influenced by stabilization policy. One of the undesirable side effects of this has been that the economy now has a greater tendency to suffer from
(Multiple Choice)
4.9/5 (40)
Aggregation involves adding together different products and services.
(True/False)
4.8/5 (34)
Technological breakthroughs, such as the Internet, can be shown with a rightward shift of the aggregate supply curve.
(True/False)
4.8/5 (32)
Which of the following is a true measure of national output?
(Multiple Choice)
4.8/5 (26)
Filters
- Essay(0)
- Multiple Choice(0)
- Short Answer(0)
- True False(0)
- Matching(0)