Exam 21: An Introduction to Macroeconomics
Exam 1: What Is Economics261 Questions
Exam 2: The Economy: Myth and Reality185 Questions
Exam 3: The Fundamental Economic Problem: Scarcity and Choice290 Questions
Exam 4: Supply and Demand: an Initial Look337 Questions
Exam 21: An Introduction to Macroeconomics216 Questions
Exam 22: The Goals of Macroeconomic Policy212 Questions
Exam 23: Economic Growth: Theory and Policy228 Questions
Exam 24: Aggregate Demand and the Powerful Consumer219 Questions
Exam 25: Demand-Side Equilibrium: Unemployment or Inflation216 Questions
Exam 26: Bringing in the Supply Side: Unemployment and Inflation228 Questions
Exam 27: Managing Aggregate Demand: Fiscal Policy210 Questions
Exam 28: Money and the Banking System224 Questions
Exam 29: Monetary Policy: Conventional and Unconventional210 Questions
Exam 30: The Financial Crisis and the Great Recession66 Questions
Exam 31: The Debate Over Monetary and Fiscal Policy219 Questions
Exam 32: Budget Deficits in the Short and Long Run215 Questions
Exam 33: The Trade-Off Between Inflation and Unemployment219 Questions
Exam 34: International Trade and Comparative Advantage226 Questions
Exam 35: The International Monetary System: Order or Disorder218 Questions
Exam 36: Exchange Rates and the Macroeconomy219 Questions
Exam 37: Contemporary Issues in the Us Economy23 Questions
Select questions type
Aggregate demand and supply curves have been widely used to analyze the performance of the macroeconomy. Figure 5-3 shows four diagrams that represent different changes in the macroeconomy. Choose the diagram that best represents the situations described in the following questions. Figure 5-3
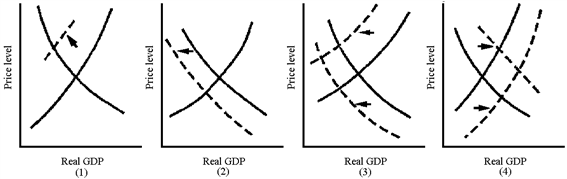 Which graph in Figure 5-3 best represents the supply-side shock of the 1970s oil crisis?
(Multiple Choice)
4.9/5  (32)
(32)
Discuss some of the fundamental differences between microeconomics and macroeconomics.
(Essay)
4.9/5 (41)
From 2000 to 2001, the U.S. economy's annual growth rate slowed down abruptly.
(True/False)
4.7/5 (28)
Before the Great Depression of the 1930s, most economists believed that
(Multiple Choice)
4.8/5 (37)
What is an aggregate? How is it used in macroeconomics? Give two examples of specific aggregates that are used in the study of macroeconomics.
(Essay)
4.8/5 (27)
Real GDP values current output of goods and services at their current prices.
(True/False)
4.9/5 (44)
Tony Stark and Steve Rogers decide to build a new gym, rather than lift weights at home. This decision
(Multiple Choice)
4.7/5 (33)
You won the lottery in 2006 for $22 million and gave your sister $500,000. Your winning contributed how much to GDP?
(Multiple Choice)
4.9/5 (38)
Donald Trump's first years in office could be illustrated by an
(Multiple Choice)
4.8/5 (40)
Stabilization policy has helped ameliorate the impact of recessions since the 1950s.
(True/False)
4.8/5 (40)
Figure 5-2
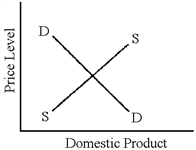 In Figure 5-2, an increase in government spending would cause
(Multiple Choice)
4.9/5 (24)
The vertical axis of the aggregate demand-aggregate supply model measures the amount of
(Multiple Choice)
4.9/5 (36)
Someone who studies the pricing policies of the Microsoft Corporation would be a microeconomist.
(True/False)
4.8/5 (33)
The recession of 1973-1975 was unusual in that both inflation and unemployment increased at the same time. This suggests that the primary cause of the recession was an
(Multiple Choice)
4.9/5 (33)
In the years after the Great Recession, the inflation rate has been
(Multiple Choice)
4.7/5 (35)
In the early 1980s, the economy experienced high unemployment with falling inflation.
(True/False)
4.8/5 (31)
During economic fluctuations, individual markets usually move in different directions.
(True/False)
4.7/5 (39)
Filters
- Essay(0)
- Multiple Choice(0)
- Short Answer(0)
- True False(0)
- Matching(0)