Exam 21: An Introduction to Macroeconomics
Exam 1: What Is Economics261 Questions
Exam 2: The Economy: Myth and Reality185 Questions
Exam 3: The Fundamental Economic Problem: Scarcity and Choice290 Questions
Exam 4: Supply and Demand: an Initial Look337 Questions
Exam 21: An Introduction to Macroeconomics216 Questions
Exam 22: The Goals of Macroeconomic Policy212 Questions
Exam 23: Economic Growth: Theory and Policy228 Questions
Exam 24: Aggregate Demand and the Powerful Consumer219 Questions
Exam 25: Demand-Side Equilibrium: Unemployment or Inflation216 Questions
Exam 26: Bringing in the Supply Side: Unemployment and Inflation228 Questions
Exam 27: Managing Aggregate Demand: Fiscal Policy210 Questions
Exam 28: Money and the Banking System224 Questions
Exam 29: Monetary Policy: Conventional and Unconventional210 Questions
Exam 30: The Financial Crisis and the Great Recession66 Questions
Exam 31: The Debate Over Monetary and Fiscal Policy219 Questions
Exam 32: Budget Deficits in the Short and Long Run215 Questions
Exam 33: The Trade-Off Between Inflation and Unemployment219 Questions
Exam 34: International Trade and Comparative Advantage226 Questions
Exam 35: The International Monetary System: Order or Disorder218 Questions
Exam 36: Exchange Rates and the Macroeconomy219 Questions
Exam 37: Contemporary Issues in the Us Economy23 Questions
Select questions type
The Italian government collects a smaller amount of the taxes it is owed than the U.S. government. Other things being equal,
(Multiple Choice)
4.8/5  (30)
(30)
Corrected for inflation, the real GDP was only about _____ times greater in 2014 than in 1959.
(Multiple Choice)
4.8/5 (36)
In 1981, the Reagan administration employed a policy that included tax ____ while at the same time the Federal Reserve's strategy was to combat ____.
(Multiple Choice)
4.9/5 (33)
One of the initial problems facing the newly elected President Clinton was a large budget deficit.
(True/False)
4.8/5 (33)
The stagflation in the United States during the 1974-1975 period can be attributed to
(Multiple Choice)
4.9/5 (44)
The price controls on consumer goods during World War II led to
(Multiple Choice)
4.8/5 (40)
According to the text, the government can use aggregate demand management policies to reduce unemployment rates. A byproduct of this policy will be
(Multiple Choice)
4.8/5 (31)
What was suggested by Keynes to move the economy out of a depressed state?
(Multiple Choice)
4.9/5 (32)
An economist who studies the sales and profits of a large corporation would be classified as a(n)
(Multiple Choice)
4.9/5 (42)
Aggregate demand and supply curves have been widely used to analyze the performance of the macroeconomy. Figure 5-3 shows four diagrams that represent different changes in the macroeconomy. Choose the diagram that best represents the situations described in the following questions. Figure 5-3
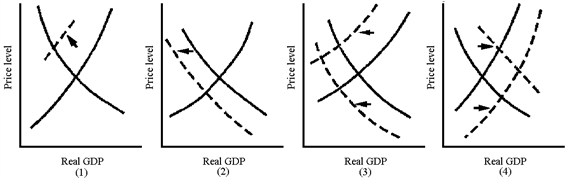 Which graph in Figure 5-3 best represents the aggregate demand-induced Great Depression of the 1930s?
(Multiple Choice)
4.9/5 (42)
The Iranian Revolution in 1979 led to another interruption of oil supplies to the United States. This caused the reoccurrence of
(Multiple Choice)
4.9/5 (39)
Dissatisfaction with public school education has led many parents to try home schooling for their children. If parents reduce their work from a full-time to a part-time load in order to spend time teaching their children at home, how will this affect GDP?
(Multiple Choice)
4.8/5 (29)
Define and distinguish between real and nominal GDP. Explain why the distinction is important to economists.
(Essay)
4.8/5 (41)
If the prices of all goods and services rise during the year,
(Multiple Choice)
4.8/5 (31)
According to Keynes, a pessimistic outlook causes consumers and businesspersons to ____, and a recession could occur.
(Multiple Choice)
4.7/5 (35)
Does GDP for a particular year include items produced in a previous year?
(Multiple Choice)
4.9/5 (29)
Technically speaking, in what year did the "Great Recession" end?
(Multiple Choice)
4.8/5 (38)
Filters
- Essay(0)
- Multiple Choice(0)
- Short Answer(0)
- True False(0)
- Matching(0)