Exam 10: Regression
Exam 1: Introduction61 Questions
Exam 2: Basic Concepts58 Questions
Exam 3: Displaying Data57 Questions
Exam 4: Measures of Central Tendency55 Questions
Exam 5: Measures of Variability62 Questions
Exam 6: The Normal Distribution59 Questions
Exam 7: Basic Concepts of Probability61 Questions
Exam 8: Sampling Distributions and Hypothesis Testing69 Questions
Exam 9: Correlation71 Questions
Exam 10: Regression66 Questions
Exam 11: Multiple Regression58 Questions
Exam 12: Hypothesis Tests Applied to Means: One Sample67 Questions
Exam 13: Hypothesis Tests Applied to Means: Two Related Samples59 Questions
Exam 14: Hypothesis Tests Applied to Means: Two Independent Samples63 Questions
Exam 15: Power70 Questions
Exam 16: One-Way Analysis of Variance85 Questions
Exam 17: Factorial Analysis of Variance74 Questions
Exam 18: Repeated-Measures Analysis of Variance62 Questions
Exam 19: Chi-Square56 Questions
Exam 20: Nonparametric and Resampling Statistical Tests45 Questions
Exam 21: Meta-Analysis57 Questions
Select questions type
In a scatterplot, an outlier is one that
Free
(Multiple Choice)
4.8/5  (40)
(40)
Correct Answer: Verified
C
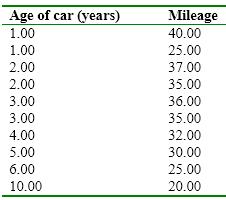 -Calculate SSerror for the previous data. Explain how you did it.
Free
(Essay)
4.8/5 (32)
Correct Answer:Verified
SS error = 170.6. I calculated it by summing the square of each residual. (See above table)
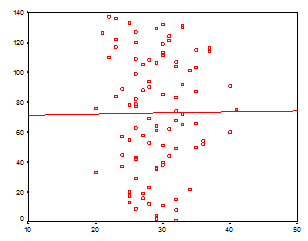
Given the following data, do you believe the regression equation would be a reliable way to predict values of Y. Explain your answer.
Free
(Essay)
4.8/5 (27)
Correct Answer:Verified
No. From looking at the graph, the line of best fit is not very fitting at all. There are large deviations between the line of best fit and many individual points on the line. Further, the regression line is practically flat, suggesting the association between X and Y is not different from 0. It would be unwise to predict Y from a variable that is not related to it. This would be no better than just guessing.
In calculating the regression coefficients we square the errors of prediction because
(Multiple Choice)
4.8/5 (31)
If you want to plot the regression line, after having found the regression equation, you need to calculate Ŷ for _______ value(s) of X .
(Multiple Choice)
4.9/5 (32)
When there is only one predictor variable in a regression, beta (regression coefficient) = r (correlation coefficient).
(True/False)
4.8/5 (36)
When we use a regression equation to make a prediction, the errors that we make are often referred to as
(Multiple Choice)
4.7/5 (37)
Regression is only appropriate for predicting a criterion variable from one predictor variable.
(True/False)
4.9/5 (33)
An example in the text hypothesized that 4% of the variability in life expectancy was accounted for by variability in smoking behavior. The values of r and r2 , respectively, are equal to
(Multiple Choice)
4.8/5 (37)
Given this regression equation, Ŷ = .75 X + 5, estimate Y for the following values of X.
a. X = 0
b. X = 1
c. X = -3
d. X = 75
(Short Answer)
5.0/5 (39)
Answer the following questions based on the regression data in the previous table.
a. What percent of variability in behavior problems is accounted for by anger?
b. What percent of variability in behavior problems independent of anger?
(Essay)
4.7/5 (44)
In the equation for a straight line used in the text, the slope is represented by
(Multiple Choice)
4.8/5 (33)
If we want to specify the percentage of the overall variability in life expectancy attributable to variability in smoking behavior, the statistic we want to look at is
(Multiple Choice)
4.8/5 (42)
If the correlation between a body image measure and an eating disorders measure is .50, we can conclude that
(Multiple Choice)
4.8/5 (30)
When we make a prediction using a regression equation, our prediction is _______ on X .
(Multiple Choice)
4.8/5 (26)
Filters
- Essay(0)
- Multiple Choice(0)
- Short Answer(0)
- True False(0)
- Matching(0)