Exam 3: Displaying Data
Exam 1: Introduction61 Questions
Exam 2: Basic Concepts58 Questions
Exam 3: Displaying Data57 Questions
Exam 4: Measures of Central Tendency55 Questions
Exam 5: Measures of Variability62 Questions
Exam 6: The Normal Distribution59 Questions
Exam 7: Basic Concepts of Probability61 Questions
Exam 8: Sampling Distributions and Hypothesis Testing69 Questions
Exam 9: Correlation71 Questions
Exam 10: Regression66 Questions
Exam 11: Multiple Regression58 Questions
Exam 12: Hypothesis Tests Applied to Means: One Sample67 Questions
Exam 13: Hypothesis Tests Applied to Means: Two Related Samples59 Questions
Exam 14: Hypothesis Tests Applied to Means: Two Independent Samples63 Questions
Exam 15: Power70 Questions
Exam 16: One-Way Analysis of Variance85 Questions
Exam 17: Factorial Analysis of Variance74 Questions
Exam 18: Repeated-Measures Analysis of Variance62 Questions
Exam 19: Chi-Square56 Questions
Exam 20: Nonparametric and Resampling Statistical Tests45 Questions
Exam 21: Meta-Analysis57 Questions
Select questions type
Boxplots are graphical displays that
Free
(Multiple Choice)
4.7/5  (30)
(30)
Correct Answer: Verified
D
Answer the following questions based on the graph below.
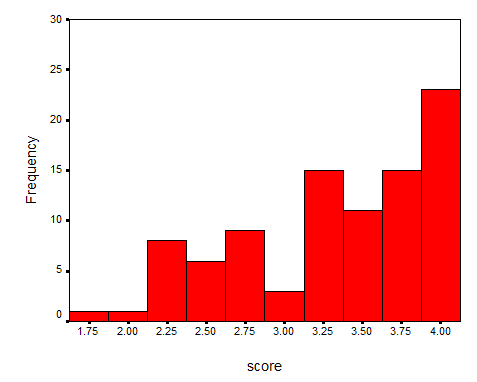 a. Is the graph symmetrical?
b. Is the graph unimodal or bimodal?
c. Do the data appear skewed? If so, positively or negatively?
d. Do there appear to be outliers? If so, for what values?
a. Is the graph symmetrical?
b. Is the graph unimodal or bimodal?
c. Do the data appear skewed? If so, positively or negatively?
d. Do there appear to be outliers? If so, for what values?
Free
(Essay)
4.8/5 (39)
Correct Answer:Verified
a. The graph is not symmetrical.
b. The graph is unimodal.
c. The data are positively skewed.
d. There are no outliers.
A negatively skewed distribution
Free
(Multiple Choice)
4.7/5 (34)
Correct Answer:Verified
A
If the distribution of the ages of people were positively skewed, which of the following is most likely correct?
(Multiple Choice)
4.7/5 (20)
Inglehart (1990) presented data on the mean Satisfaction with Life scores for 24 developed countries. These data follow:
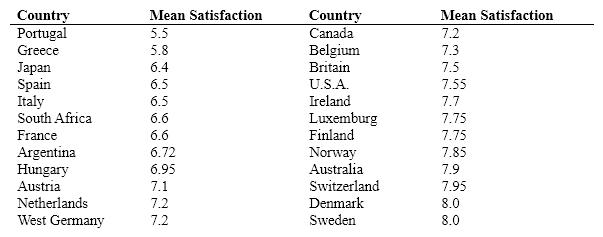 A histogram of these data would be
(Multiple Choice)
4.8/5 (25)
The next six questions are based on the following data. 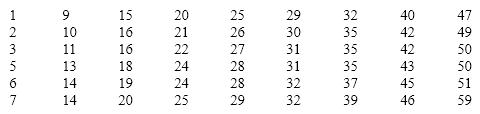 -Which graphical technique do you think displays the data least effectively? Why?
(Essay)
4.8/5 (36)
Skewness refers to how symmetrical or assymetrical a distribution is.
(True/False)
4.9/5 (38)
The next six questions are based on the following data.
-Create a frequency distribution for these data.
(Essay)
4.8/5 (25)
If you created a stem-and-leaf display of the math SAT scores of all entering students in a large Midwestern state university, the leaves would most likely be
(Multiple Choice)
4.8/5 (31)
On October 25, 1978 the Washington Post presented a graphic showing the declining purchasing power of the U.S. dollar. What was worth $1 in 1958 was worth only $0.44 in 1978. They illustrated the decline in value by showing a dollar that was 3 inches by 1 inch in 1959, and one that was 1.32 inches (44% of 3 inches) by .44 inches in 1978. What is wrong with this kind of a display?
(Multiple Choice)
4.7/5 (36)
The data in the previous question show a much higher incidence of low birth weight babies from mothers who smoke. This finding is likely to be a reliable one because
(Multiple Choice)
4.8/5 (43)
Answer the following questions based on the graph below.
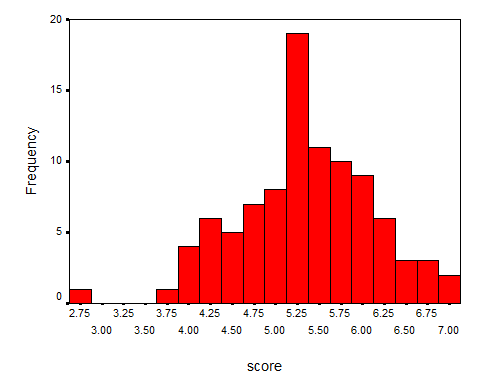 a. Is the graph symmetrical?
b. Is the graph unimodal or bimodal?
c. Do the data appear skewed? If so, positively or negatively?
d. Do there appear to be outliers? If so, for what values?
a. Is the graph symmetrical?
b. Is the graph unimodal or bimodal?
c. Do the data appear skewed? If so, positively or negatively?
d. Do there appear to be outliers? If so, for what values?
(Essay)
4.7/5 (43)
On a recent fundraising drive, most of the 30 volunteers raised between $10 and $50 each. However, Brian and Karen each raised over $100. Which of the following is true?
(Multiple Choice)
4.8/5 (34)
The onset of eating disorders was shown to occur most often during puberty and during the late teen years in girls. A distribution of the frequencies of onset of eating disorders by age would most likely be
(Multiple Choice)
4.8/5 (36)
Assume that we had the following set of data:
 T hese data would most likely be characterized as
(Multiple Choice)
4.8/5 (34)
An outlier refers to data that falls toward the middle of a distribution.
(True/False)
4.9/5 (35)
Filters
- Essay(0)
- Multiple Choice(0)
- Short Answer(0)
- True False(0)
- Matching(0)