Exam 18: Understanding and Representing Concepts of Data
Exam 1: Elementary Mathematics for the 21st Century10 Questions
Exam 2: Defining a Comprehensive Mathematics Program16 Questions
Exam 3: Mathematics for Every Child37 Questions
Exam 4: Learning Mathematics39 Questions
Exam 5: Organizing Effective Instruction37 Questions
Exam 6: Integrating Assessment41 Questions
Exam 7: Developing Problem-Solving Strategies43 Questions
Exam 8: Developing Concepts of Number42 Questions
Exam 9: Extending Number Concepts and Number Systems43 Questions
Exam 10: Developing Number Operations With Whole Numbers48 Questions
Exam 11: Extending Computational Fluency With Larger Numbers41 Questions
Exam 12: Developing Understanding of Common and Decimal Fractions45 Questions
Exam 13: Extending Understanding of Common and Decimal Fractions48 Questions
Exam 14: Developing Aspects of Proportional Reasoning: Ratio, Proportion, and Percent49 Questions
Exam 15: Thinking Algebraically43 Questions
Exam 16: Developing and Extending Geometric Concepts and Systems47 Questions
Exam 17: Developing and Extending Measurement Concepts44 Questions
Exam 18: Understanding and Representing Concepts of Data43 Questions
Exam 19: Investigating Probability47 Questions
Select questions type
The difference between an object graph and a picture graph is that:
(Multiple Choice)
4.8/5  (38)
(38)
An outlier will affect which of the following measures the most?
(Multiple Choice)
4.9/5 (31)
A TV reporter showed this graph during a newscast and said: "The graph shows that there is a huge increase in the number of robberies from 2016 to 2017."
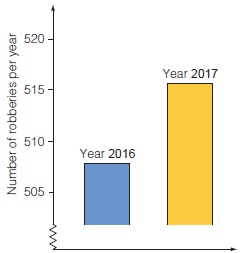 Do you consider the reporter's statement to be a reasonable interpretation of the graph? Give an explanation to support your answer.
(Not Answered)
This question doesn't have any answer yet
Filters
- Essay(0)
- Multiple Choice(0)
- Short Answer(0)
- True False(0)
- Matching(0)