Exam 18: Understanding and Representing Concepts of Data
Exam 1: Elementary Mathematics for the 21st Century10 Questions
Exam 2: Defining a Comprehensive Mathematics Program16 Questions
Exam 3: Mathematics for Every Child37 Questions
Exam 4: Learning Mathematics39 Questions
Exam 5: Organizing Effective Instruction37 Questions
Exam 6: Integrating Assessment41 Questions
Exam 7: Developing Problem-Solving Strategies43 Questions
Exam 8: Developing Concepts of Number42 Questions
Exam 9: Extending Number Concepts and Number Systems43 Questions
Exam 10: Developing Number Operations With Whole Numbers48 Questions
Exam 11: Extending Computational Fluency With Larger Numbers41 Questions
Exam 12: Developing Understanding of Common and Decimal Fractions45 Questions
Exam 13: Extending Understanding of Common and Decimal Fractions48 Questions
Exam 14: Developing Aspects of Proportional Reasoning: Ratio, Proportion, and Percent49 Questions
Exam 15: Thinking Algebraically43 Questions
Exam 16: Developing and Extending Geometric Concepts and Systems47 Questions
Exam 17: Developing and Extending Measurement Concepts44 Questions
Exam 18: Understanding and Representing Concepts of Data43 Questions
Exam 19: Investigating Probability47 Questions
Select questions type
A student asks you to explain why there are both histograms and bar graphs. Give examples that illustrate the differences between these two types of graphs.
(Essay)
4.7/5  (45)
(45)
NAEP: The pie chart below shows the portion of time Brooklyn spent on homework in each subject last week.
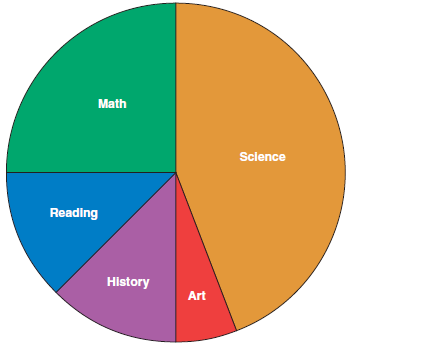 If Brooklyn spent two hours on mathematics, about how many hours did Brooklyn spend on homework altogether?
(Multiple Choice)
4.9/5 (41)
TIMSS: The graph below shows the number of pens, pencils, rulers, and erasers sold by a store in one week.
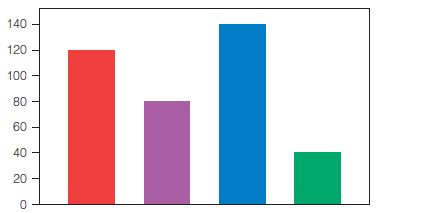 The names of the items are missing from the graph. Pens were the item most often sold, and fewer erasers than any other items were sold. More pencils than rulers were sold. How many pencils were sold?
(Multiple Choice)
4.9/5 (41)
In order to determine the favorite ice cream flavor of the class, you would determine the
(Multiple Choice)
4.8/5 (34)
Which of the following is not a characteristic of a hat plot?
(Multiple Choice)
4.9/5 (36)
Children have difficulty deciding when the mode, median, and mean would be appropriate measures of data. Give one situation for each measure of central tendency that would help children remember the differences and uses for these measures.
(Essay)
4.8/5 (37)
Find the median of the following set:
{7, 9, 12, 6, 18, 44}
(Multiple Choice)
4.7/5 (34)
Suppose childre n are asked to give the number of children in their families, and they find that two children is the most frequent answer. They are working with the:
(Multiple Choice)
4.7/5 (29)
Data collection is more meaningful for younger children if it relates to their lives. Give three examples of data collection activities that would further children's understanding of data collection.
(Essay)
4.9/5 (30)
A line graph could be used in each of the following situations except for :
(Multiple Choice)
4.9/5 (31)
In order to find the class average on a test, you would determine the
(Multiple Choice)
4.8/5 (38)
What are two misconceptions children are prone to experience when working with bar graphs?
(Short Answer)
4.7/5 (33)
Prerequisites for constructing circle graphs include all of the following except for :
(Multiple Choice)
4.8/5 (31)
Comparing a bar graph to a histogram, which of the following is a true statement?
(Multiple Choice)
4.9/5 (27)
Circle graphs are difficult for children to create until they have reached the maturation level of middle school. What are some ways that elementary teachers can introduce circle graphs before that time?
(Essay)
4.8/5 (32)
Filters
- Essay(0)
- Multiple Choice(0)
- Short Answer(0)
- True False(0)
- Matching(0)