Exam 13: Association Between Variables Measured at the Interval Ratio Level
Exam 1: Introduction37 Questions
Exam 2: Basic Descriptive Statistics Tables Percentages Rates and Ratios and Graphs29 Questions
Exam 3: Measures of Central Tendency37 Questions
Exam 4: Measures of Variation37 Questions
Exam 5: The Normal Curve37 Questions
Exam 6: Introduction to Inferential Statistics Sampling and the Sampling Distribution37 Questions
Exam 7: Estimation Procedures37 Questions
Exam 8: Hypothesis Testing I the One Sample Case37 Questions
Exam 9: Hypothesis Testing Ii the Two Sample Case37 Questions
Exam 10: Hypothesis Testing Iii the Analysis of Variance37 Questions
Exam 11: Hypothesis Testing Iv Chi Square37 Questions
Exam 12: Bivariate Association for Nominal and Ordinal Level Variables34 Questions
Exam 13: Association Between Variables Measured at the Interval Ratio Level37 Questions
Exam 14: Elaborating Bivariate Tables37 Questions
Exam 15: Partial Correlation and Multiple Regression and Correlation37 Questions
Select questions type
One important function of the least-squares regression equation is that________.
Free
(Multiple Choice)
4.9/5  (46)
(46)
Correct Answer: Verified
D
In a study of the relationship between geographical mobility (number of times a person has changed residences) and number of friends, Pearson's r is reported as .40. Which of the following would be a correct interpretation?
Free
(Multiple Choice)
4.9/5 (43)
Correct Answer:Verified
D
In addition to random sampling, interval-ratio level of measurement, and a normal sampling distribution, model assumptions for testing Pearson's r for significance include________.
Free
(Multiple Choice)
4.8/5 (32)
Correct Answer:Verified
D
The appropriate measure of association for situations in which both variables are interval-ratio in level of measurement is________.
(Multiple Choice)
4.8/5 (37)
One important limitation of the study of poverty and crime reported in the text is that________.
(Multiple Choice)
4.7/5 (35)
If you wanted to measure the association between the age of people (in years) and the number of arrests for driving while intoxicated, the most appropriate measure of association would be________.
(Multiple Choice)
4.8/5 (32)
The direction of a relationship between variables can be detected on a scatterplot by considering the angle of the regression line. The relationship is________.
(Multiple Choice)
4.9/5 (36)
After scores of all cases have been located on a scatterplot, a straight line drawn so that it comes as close as possible to touching every score is called the________.
(Multiple Choice)
4.8/5 (31)
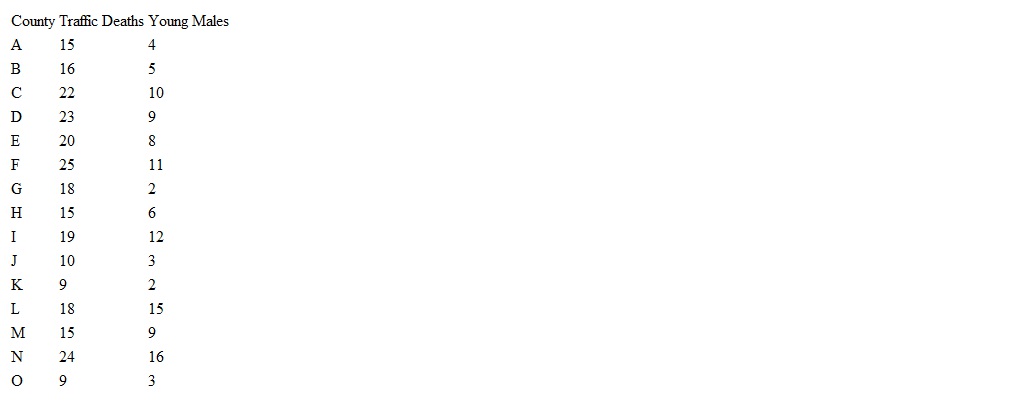
For a sample of 15 rural counties in one state, a researcher has collected information about the rate of deaths due to traffic accidents per 1,000,000 population and the percentage of the population which consists of males, age 16 to 25. For these variables, find the least squares regression line and compute r and r squared. Write a sentence or two summarizing and explaining your results.
(Not Answered)
This question doesn't have any answer yet
If a = 2 and b = 4, what would the value of Y be when X = 1?
(Multiple Choice)
4.9/5 (39)
A perfect association between variables can be seen on a scatterplot when________.
(Multiple Choice)
4.7/5 (24)
A study of traffic safety shows a correlation of 0.57 between average speed of traffic and number of fatal accidents for a particular stretch of highway. This means that________.
(Multiple Choice)
4.8/5 (27)
Dummy variables make it possible to include ________ in regression analysis.
(Multiple Choice)
4.9/5 (33)
The conditional mean of Y for any value of X is found by________.
(Multiple Choice)
5.0/5 (33)
When testing Pearson's r for significance, the null hypothesis is that________.
(Multiple Choice)
4.8/5 (28)
In the study reported in the text, the Pearson's r between the measures of poverty and homicide was 0.57. Which of the following is a reasonable interpretation of this result?
(Multiple Choice)
4.8/5 (23)
By convention, the independent variable is arrayed along the ______________ in a scatterplot.
(Multiple Choice)
4.8/5 (25)
Filters
- Essay(0)
- Multiple Choice(0)
- Short Answer(0)
- True False(0)
- Matching(0)