Exam 4: Measures of Variation
Exam 1: Introduction37 Questions
Exam 2: Basic Descriptive Statistics Tables Percentages Rates and Ratios and Graphs29 Questions
Exam 3: Measures of Central Tendency37 Questions
Exam 4: Measures of Variation37 Questions
Exam 5: The Normal Curve37 Questions
Exam 6: Introduction to Inferential Statistics Sampling and the Sampling Distribution37 Questions
Exam 7: Estimation Procedures37 Questions
Exam 8: Hypothesis Testing I the One Sample Case37 Questions
Exam 9: Hypothesis Testing Ii the Two Sample Case37 Questions
Exam 10: Hypothesis Testing Iii the Analysis of Variance37 Questions
Exam 11: Hypothesis Testing Iv Chi Square37 Questions
Exam 12: Bivariate Association for Nominal and Ordinal Level Variables34 Questions
Exam 13: Association Between Variables Measured at the Interval Ratio Level37 Questions
Exam 14: Elaborating Bivariate Tables37 Questions
Exam 15: Partial Correlation and Multiple Regression and Correlation37 Questions
Select questions type
As a distribution of scores becomes more variable, the value of the standard deviation________.
Free
(Multiple Choice)
5.0/5  (45)
(45)
Correct Answer: Verified
C
If the standard deviation of a group of scores is 0,________.
Free
(Multiple Choice)
4.8/5 (38)
Correct Answer:Verified
C
The information below compares the final exam grades for 2 biology classes: 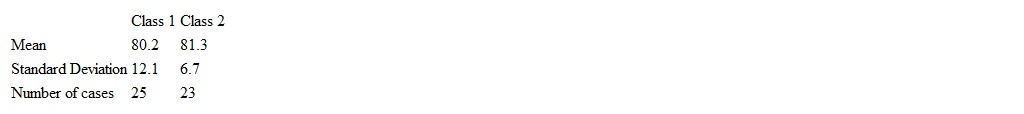 What may we conclude? Class 1 _______.
Free
(Multiple Choice)
4.9/5 (29)
Correct Answer:Verified
B
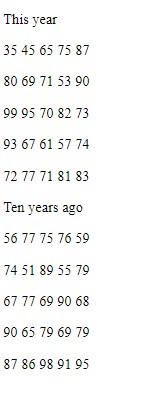
The scores below are from the same final exam given in a math class in two different years. Compute the mean and median (if necessary) and the range and standard deviation of these scores. Using these statistics, describe the differences in the two sets of scores.
(Not Answered)
This question doesn't have any answer yet
A boxplot uses all but which of the following to present dispersion?
(Multiple Choice)
5.0/5 (37)
If a distribution of scores has a mean of 30 and a range of 0________.
(Multiple Choice)
4.9/5 (34)
If distribution A and distribution B have the same mean but A has a larger standard deviation, we may conclude that________.
(Multiple Choice)
4.8/5 (32)
Your score on the test is the same as the third quartile (Q3). You may conclude that________.
(Multiple Choice)
4.7/5 (36)
The greater the skew of a distribution of scores, ________.
(Multiple Choice)
4.9/5 (43)
The range (R) is found by subtracting the lowest from the highest score in the distribution. Therefore, R could NOT be found for________.
(Multiple Choice)
4.9/5 (35)
Some information about auto theft rates (number of auto thefts per 100,000 population) for a sample of 178 cities in two different years is summarized below.
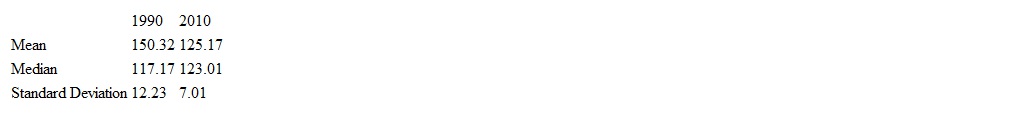 Express this statistical information in words. What changes were there in the overall shape of the variation of this variable? In central tendency? In dispersion?
(Not Answered)
This question doesn't have any answer yet
A graph used to visualize and analyze variation is a________.
(Multiple Choice)
4.8/5 (25)
Which of the following data sets shows the greatest variability?
(Multiple Choice)
4.9/5 (35)
In a boxplot, an outlier is defined as a score that is________.
(Multiple Choice)
4.9/5 (27)
If a variable is interval-ratio in level of measurement, the preferred measure of variation would be________.
(Multiple Choice)
4.8/5 (31)
Four students have applied to a special program and only one can be accepted. They have taken a battery of 12 tests and all have exactly the same average score. The standard deviation of their test scores are: Student A = 3.12, Student B = 0.27, Student C = 13.45, Student D = 6.45. If consistency of performance is a criterion for acceptance, which of the four students should be selected?
(Multiple Choice)
4.9/5 (36)
If the variance of a distribution is 16, the mean is 12, and the number of cases is 24, the standard deviation is________.
(Multiple Choice)
4.8/5 (36)
Filters
- Essay(0)
- Multiple Choice(0)
- Short Answer(0)
- True False(0)
- Matching(0)