Exam 2: Basic Descriptive Statistics Tables Percentages Rates and Ratios and Graphs
Exam 1: Introduction37 Questions
Exam 2: Basic Descriptive Statistics Tables Percentages Rates and Ratios and Graphs29 Questions
Exam 3: Measures of Central Tendency37 Questions
Exam 4: Measures of Variation37 Questions
Exam 5: The Normal Curve37 Questions
Exam 6: Introduction to Inferential Statistics Sampling and the Sampling Distribution37 Questions
Exam 7: Estimation Procedures37 Questions
Exam 8: Hypothesis Testing I the One Sample Case37 Questions
Exam 9: Hypothesis Testing Ii the Two Sample Case37 Questions
Exam 10: Hypothesis Testing Iii the Analysis of Variance37 Questions
Exam 11: Hypothesis Testing Iv Chi Square37 Questions
Exam 12: Bivariate Association for Nominal and Ordinal Level Variables34 Questions
Exam 13: Association Between Variables Measured at the Interval Ratio Level37 Questions
Exam 14: Elaborating Bivariate Tables37 Questions
Exam 15: Partial Correlation and Multiple Regression and Correlation37 Questions
Select questions type
A small town of 1,709 residents had one homicide in the past year. The homicide rate for this town________.
Free
(Multiple Choice)
4.9/5  (46)
(46)
Correct Answer: Verified
B
A _____ is the number of times a phenomenon occurs divided by the total possible occurrences.
Free
(Multiple Choice)
4.7/5 (38)
Correct Answer:Verified
A
Frequency distributions may be compiled for variables measured at which level?
Free
(Multiple Choice)
4.8/5 (31)
Correct Answer:Verified
D
Forty of every two hundred students attend all of their classes. What percentage of the student body is this?
(Multiple Choice)
4.8/5 (34)
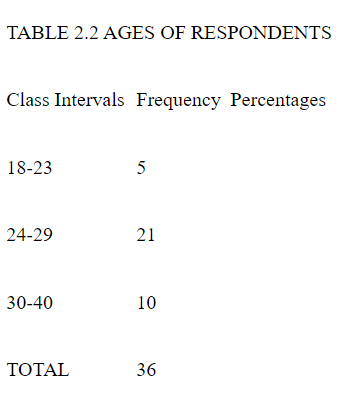 -If we added a cumulative percentage column to Table 2.2 and began our calculations with the 18-23 interval, the entry in the 30-40 interval would be________.
(Multiple Choice)
5.0/5 (22)
Cumulative frequencies and cumulative percentages allow a researcher to________.
(Multiple Choice)
4.8/5 (27)
For a single variable measured at the nominal level, an appropriate graph would be a________.
(Multiple Choice)
4.8/5 (35)
Twenty-three of the 50 states rejected a proposed constitutional amendment to make the house fly the National Insect. What percentage is this?
(Multiple Choice)
5.0/5 (35)
For a single variable at the interval-ratio level, an appropriate graph would be________.
(Multiple Choice)
4.9/5 (44)
A researcher wants to visually display the U.S. divorce rate (a continuous, interval-ratio level variable) for the last 50 years. An appropriate format would be________.
(Multiple Choice)
4.9/5 (39)
The frequency distribution below displays the distribution of age for a sample drawn from a community. Finish the table by completing the columns for percentages, and cumulative percentages.
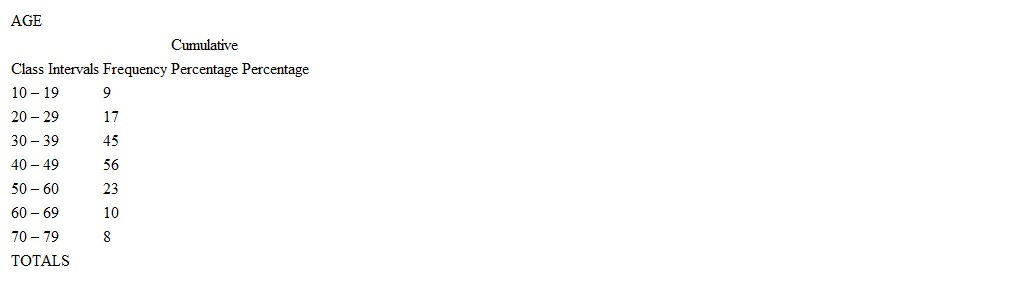
(Not Answered)
This question doesn't have any answer yet
Which of the following is an impossible value for a percentage?
(Multiple Choice)
4.8/5 (41)
When constructing frequency distributions for variables measured at the interval-ratio level, approximate interval size (or interval width) can be found by________.
(Multiple Choice)
4.7/5 (41)
If class intervals overlap with one another, there will be issues of________.
(Multiple Choice)
4.8/5 (42)
A city of 1567 people had 34 auto thefts last year. The auto theft rate for this city________.
(Multiple Choice)
4.8/5 (32)
When examining a single categorical variable with emphasis on the differences between two or more categories, it is best to use a________.
(Multiple Choice)
4.8/5 (39)
If 60 cases range in score from 4 to 84 and you want 10 intervals in a frequency distribution, approximately what will be the width of each interval?
(Multiple Choice)
4.8/5 (35)
The class intervals below represent ages of respondents. Which set of intervals is both exhaustive and mutually exclusive?
(Multiple Choice)
4.8/5 (34)
Proportions and percentages, ratios and rates are all ways of expressing________.
(Multiple Choice)
4.9/5 (38)
Filters
- Essay(0)
- Multiple Choice(0)
- Short Answer(0)
- True False(0)
- Matching(0)