Exam 4: Supply and Demand: Applications and Extensions
Exam 1: The Economic Approach185 Questions
Exam 2: Some Tools of the Economist204 Questions
Exam 3: Demand, Supply, and the Market Process339 Questions
Exam 4: Supply and Demand: Applications and Extensions268 Questions
Exam 5: Difficult Cases for the Market, and the Role of Government134 Questions
Exam 6: The Economics of Political Action161 Questions
Exam 7: Taking the Nations Economic Pulse222 Questions
Exam 8: Economic Fluctuations, Unemployment, and Inflation182 Questions
Exam 9: An Introduction to Basic Macroeconomic Markets219 Questions
Exam 10: Dynamic Change, Economic Fluctuations, and the Ad--As Model193 Questions
Exam 11: Fiscal Policy: The Keynesian View and the Historical Development of Macroeconomics112 Questions
Exam 12: Fiscal Policy: Incentives, and Secondary Effects154 Questions
Exam 13: Money and the Banking System198 Questions
Exam 14: Modern Macroeconomics and Monetary Policy204 Questions
Exam 15: Stabilization Policy, Output, and Employment170 Questions
Exam 16: Creating an Environment for Growth and Prosperity125 Questions
Exam 17: Institutions, Policies, and Cross-Country Differences in Income and Growth115 Questions
Exam 18: Gaining From International Trade182 Questions
Exam 19: International Finance and the Foreign Exchange Market148 Questions
Exam 20: Special Topics274 Questions
Select questions type
Figure 4-21  Refer to Figure 4-21. The price paid by buyers after the tax is imposed is
(Multiple Choice)
4.8/5  (33)
(33)
A price ceiling set below an equilibrium price tends to cause persistent imbalances in the market because
(Multiple Choice)
4.8/5 (30)
Figure 4-20 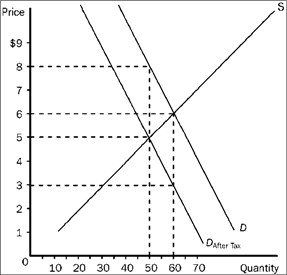 Refer to Figure 4-20. The price that buyers pay after the tax is imposed is
(Multiple Choice)
4.9/5 (33)
Suppose that the minimum wage was increased to $10 per hour. Which of the following would be most likely to result from the minimum wage increase?
(Multiple Choice)
4.8/5 (28)
Use the figure below to answer the following question(s). Figure 4-8
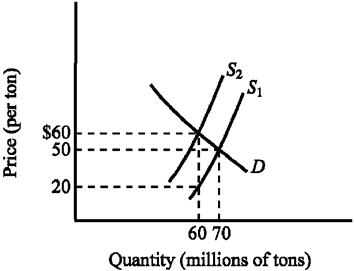 Refer to Figure 4-8. The supply curve S1 and the demand curve D indicate initial conditions in the market for soft coal. A $40-per-ton tax on soft coal is levied, shifting the supply curve from S1 to S2. Imposing the tax increases the equilibrium price of soft coal from
(Multiple Choice)
4.8/5 (27)
Figure 4-21 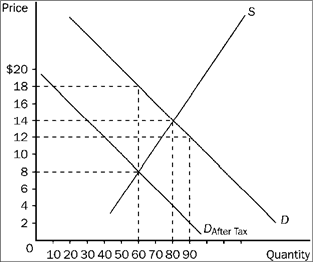 Refer to Figure 4-21. The per-unit burden of the tax is
(Multiple Choice)
4.8/5 (36)
Figure 4-21  Refer to Figure 4-21. How much tax revenue does this tax produce for the government?
(Multiple Choice)
4.8/5 (30)
The large amount of violence associated with the current drug trade is mostly caused by
(Multiple Choice)
4.9/5 (37)
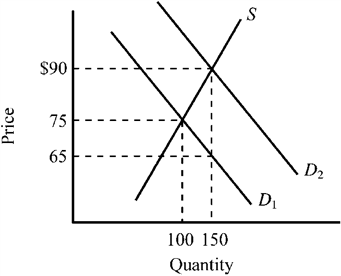
Use the figure below to answer the following question(s). Figure 4-9
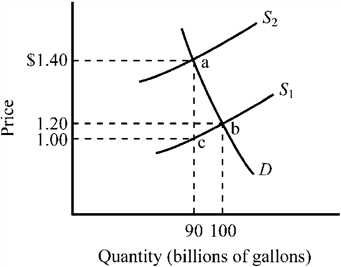 Refer to Figure 4-9. The market for gasoline was initially in equilibrium at point b and a $.40 excise tax is illustrated. How much revenue would the $.40 gasoline tax raise?
(Multiple Choice)
4.8/5 (31)
If a $50 subsidy is legally (statutorily) granted to the sellers of weed eaters and as a result the price of weed eaters to consumers falls by $30, the actual benefit of the subsidy
(Multiple Choice)
4.7/5 (41)
The more inelastic the demand for a product, the more likely that the actual benefit of a subsidy granted on the product will
(Multiple Choice)
4.8/5 (37)
Figure 4-17 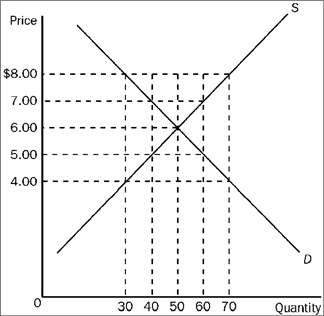 Refer to Figure 4-17. Suppose a price floor of $7.00 is imposed. As a result,
(Multiple Choice)
4.8/5 (36)
Suppose the equilibrium price of a physical examination ("physical") by a doctor is $200, and the government imposes a price ceiling of $150 per physical. As a result of the price ceiling,
(Multiple Choice)
4.8/5 (41)
Which of the following would tend to increase the price of lumber?
(Multiple Choice)
5.0/5 (30)
A payment the government makes to either the buyer or seller, usually on a per-unit basis, when a good or service is purchased or sold is called a
(Multiple Choice)
4.9/5 (37)
Figure 4-5 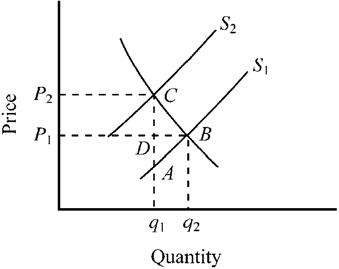 Figure 4-5 represents the market for gasoline before and after a per-gallon tax. What does the triangular area ABC represent?
(Multiple Choice)
4.9/5 (32)
Use the figure below to answer the following question(s). Figure 4-13
 Refer to Figure 4-13. The exhibit illustrates the impact of granting a subsidy on a particular good. Which of the following is true for this subsidy given the information provided in the exhibit?
(Multiple Choice)
4.9/5 (32)
Filters
- Essay(0)
- Multiple Choice(0)
- Short Answer(0)
- True False(0)
- Matching(0)