Exam 4: Supply and Demand: Applications and Extensions
Exam 1: The Economic Approach185 Questions
Exam 2: Some Tools of the Economist204 Questions
Exam 3: Demand, Supply, and the Market Process339 Questions
Exam 4: Supply and Demand: Applications and Extensions268 Questions
Exam 5: Difficult Cases for the Market, and the Role of Government134 Questions
Exam 6: The Economics of Political Action161 Questions
Exam 7: Taking the Nations Economic Pulse222 Questions
Exam 8: Economic Fluctuations, Unemployment, and Inflation182 Questions
Exam 9: An Introduction to Basic Macroeconomic Markets219 Questions
Exam 10: Dynamic Change, Economic Fluctuations, and the Ad--As Model193 Questions
Exam 11: Fiscal Policy: The Keynesian View and the Historical Development of Macroeconomics112 Questions
Exam 12: Fiscal Policy: Incentives, and Secondary Effects154 Questions
Exam 13: Money and the Banking System198 Questions
Exam 14: Modern Macroeconomics and Monetary Policy204 Questions
Exam 15: Stabilization Policy, Output, and Employment170 Questions
Exam 16: Creating an Environment for Growth and Prosperity125 Questions
Exam 17: Institutions, Policies, and Cross-Country Differences in Income and Growth115 Questions
Exam 18: Gaining From International Trade182 Questions
Exam 19: International Finance and the Foreign Exchange Market148 Questions
Exam 20: Special Topics274 Questions
Select questions type
Figure 4-21 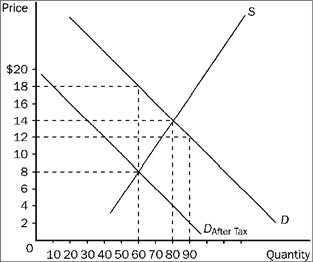 Refer to Figure 4-21. The price received by sellers after the tax is imposed is
(Multiple Choice)
4.7/5  (39)
(39)
The actual benefit of a government subsidy is determined primarily by
(Multiple Choice)
4.8/5 (33)
Figure 4-20 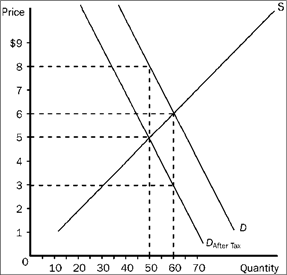 Refer to Figure 4-20. The burden of the tax on sellers is
(Multiple Choice)
4.9/5 (31)
Figure 4-21  Refer to Figure 4-21. The amount of the tax per unit is
(Multiple Choice)
4.9/5 (35)
Use the figure below to answer the following question(s). Figure 4-9
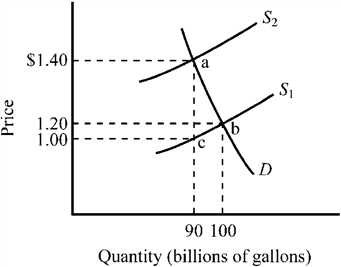 Refer to Figure 4-9. The market for gasoline was initially in equilibrium at point b and a $.40 excise tax is illustrated. Which of the following states the actual burden of the tax?
(Multiple Choice)
4.8/5 (33)
A substantial revision of the income tax code that made business and personal tax returns much easier to complete would tend to cause which of the following changes in the labor market for accountants?
(Multiple Choice)
4.9/5 (32)
Figure 4-3 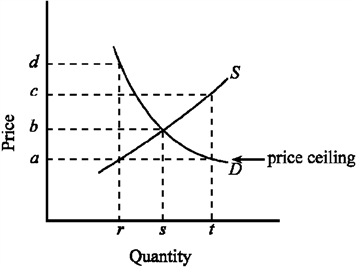 Figure 4-3 indicates the demand (D) and supply (S) for the rental housing market in a large city. If the government imposed a price ceiling of a, which of the following would be true?
(Multiple Choice)
4.9/5 (31)
Figure 4-19 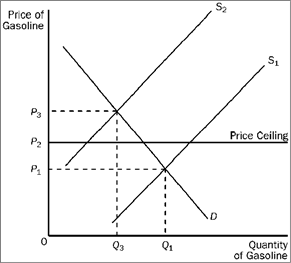 Refer to Figure 4-19. When the price ceiling applies in this market and the supply curve for gasoline shifts from S1 to S2, the resulting quantity of gasoline that is bought and sold is
(Multiple Choice)
4.9/5 (30)
When several hurricanes hit Florida in 2004, a number of local governments imposed price controls that prevented sellers from raising their prices for badly needed products like plywood and generators. In the areas where the controls were imposed, they resulted in
(Multiple Choice)
5.0/5 (44)
Figure 4-25 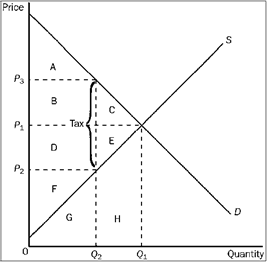 Refer to Figure 4-25. The tax causes a reduction in producer surplus that is represented by area
(Multiple Choice)
4.8/5 (33)
A price ceiling that sets the price of a good below market equilibrium will cause
(Multiple Choice)
4.9/5 (40)
If there was an increase in the excise tax imposed on guitar suppliers, what would be the effect on the equilibrium price and quantity of guitars?
(Multiple Choice)
4.8/5 (39)
If a government price control succeeds in affecting price, it can be expected to lead to a corresponding
(Multiple Choice)
5.0/5 (28)
Figure 4-22 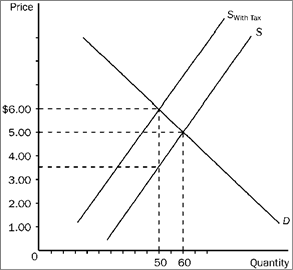 Refer to Figure 4-22. The amount of the tax per unit is
(Multiple Choice)
4.8/5 (31)
The deadweight loss (or excess burden) resulting from levying a tax on an economic activity is the
(Multiple Choice)
4.7/5 (40)
Use the figure below to answer the following question(s). Figure 4-12
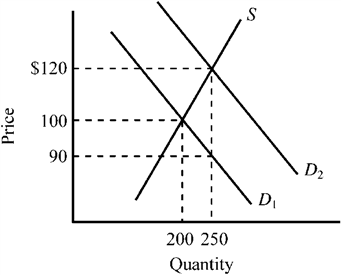 Refer to Figure 4-12. The supply curve S and the demand curve D1 indicate initial conditions in the market for college textbooks. A new government program is implemented that grants students a $30 per textbook subsidy on every textbook they purchase, shifting the demand curve from D1 to D2. Which of the following is true for this subsidy given the information provided in the exhibit?
(Multiple Choice)
4.7/5 (36)
If a $2 tax per bottle of wine is imposed on wine producers, which of the following will occur?
(Multiple Choice)
4.8/5 (31)
Use the figure below to answer the following question(s). Figure 4-7
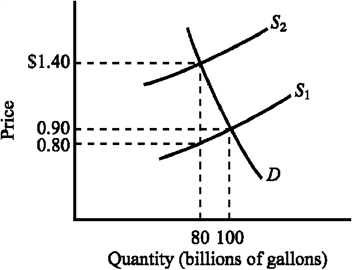 Refer to Figure 4-7. The supply curve S1 and the demand curve D indicate initial conditions in the market for gasoline. A $.60-per-gallon excise tax on gasoline is levied, which shifts the supply curve from S1 to S2. Which of the following states the actual burden of the tax?
(Multiple Choice)
4.8/5 (33)
Filters
- Essay(0)
- Multiple Choice(0)
- Short Answer(0)
- True False(0)
- Matching(0)